

Mathematics, 10.03.2021 15:40, lilyrockstarmag
Help plz
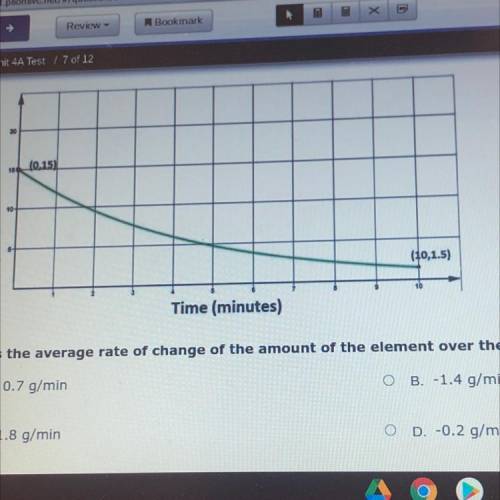
What is the average rate of change of the amount of the element over the 10-minute experiment
A. - 0.7 g/min
B. -1.4 g/min
C. -1.8 g/min
D. -0.2 g/min

Answers: 2


Other questions on the subject: Mathematics
Mathematics, 21.06.2019 21:20, DisneyGirl11
The edge of a cube was found to be 30 cm with a possible error in measurement of 0.4 cm. use differentials to estimate the maximum possible error, relative error, and percentage error in computing the volume of the cube and the surface area of the cube. (round your answers to four decimal places.) (a) the volume of the cube maximum possible error cm3 relative error percentage error % (b) the surface area of the cube maximum possible error cm2 relative error percentage error %
Answers: 3
Mathematics, 22.06.2019 03:00, dominiqueallen23
Describe how the presence of possible outliers might be identified on the following. (a) histograms gap between the first bar and the rest of bars or between the last bar and the rest of bars large group of bars to the left or right of a gap higher center bar than surrounding bars gap around the center of the histogram higher far left or right bar than surrounding bars (b) dotplots large gap around the center of the data large gap between data on the far left side or the far right side and the rest of the data large groups of data to the left or right of a gap large group of data in the center of the dotplot large group of data on the left or right of the dotplot (c) stem-and-leaf displays several empty stems in the center of the stem-and-leaf display large group of data in stems on one of the far sides of the stem-and-leaf display large group of data near a gap several empty stems after stem including the lowest values or before stem including the highest values large group of data in the center stems (d) box-and-whisker plots data within the fences placed at q1 â’ 1.5(iqr) and at q3 + 1.5(iqr) data beyond the fences placed at q1 â’ 2(iqr) and at q3 + 2(iqr) data within the fences placed at q1 â’ 2(iqr) and at q3 + 2(iqr) data beyond the fences placed at q1 â’ 1.5(iqr) and at q3 + 1.5(iqr) data beyond the fences placed at q1 â’ 1(iqr) and at q3 + 1(iqr)
Answers: 1
Do you know the correct answer?
Help plz
What is the average rate of change of the amount of the element over the 10-minute experim...
Questions in other subjects:

Biology, 04.01.2021 01:10
Mathematics, 04.01.2021 01:10


SAT, 04.01.2021 01:10


Mathematics, 04.01.2021 01:10
Mathematics, 04.01.2021 01:10

Mathematics, 04.01.2021 01:10


