

Mathematics, 10.03.2021 01:00, kaciewelkerouwdfa
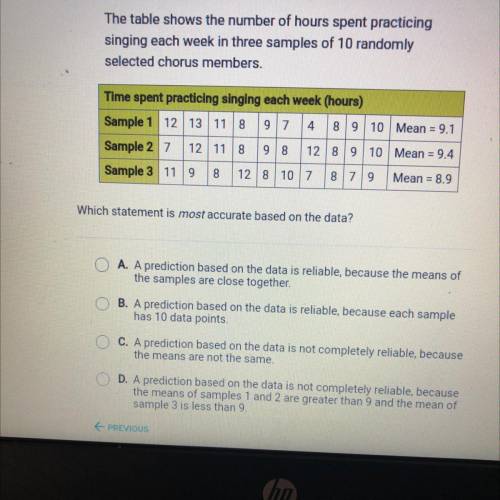
The table shows the number of hours spent practicing
singing each week in three samples of 10 randomly
selected chorus members.
Time spent practicing singing each week (hours)
Sample 1 12 13 11 8 9 7 4
8 9 10 Mean = 9.1
Sample 2 7 12 11 8 9 8 12 8 9 10 Mean = 9.4
Sample 3 11 9 8 12 8 10 7 8 7 9 Mean = 8.9
Which statement is most accurate based on the data?
A. A prediction based on the data is reliable, because the means of
the samples are close together.
OB. A prediction based on the data is reliable, because each sample
has 10 data points.
O C. A prediction based on the data is not completely reliable, because
the means are not the same.
D. A ediction based on the data is not completely reliable, because
the means of samples 1 and 2 are greater than 9 and the mean of
sample 3 is less than 9.
PREVIOUS

Answers: 1


Other questions on the subject: Mathematics
Mathematics, 22.06.2019 03:00, adrianVocke5685
The blue segment below is a diameter of o. what is the length of the radius of the circle?
Answers: 1
Mathematics, 22.06.2019 03:00, angsoccer02
Plz asap what is the range of the cluster in the scatter plot a. between 4 and 8 years of experience b. between $40,000 and $60,000 c. between 6 and 12 years of experience d. between $10,000 and $60,000
Answers: 2
Do you know the correct answer?
The table shows the number of hours spent practicing
singing each week in three samples of 10 rando...
Questions in other subjects:


Mathematics, 12.11.2019 11:31

Mathematics, 12.11.2019 11:31
Biology, 12.11.2019 11:31


