

Mathematics, 09.03.2021 21:40, samantha9014
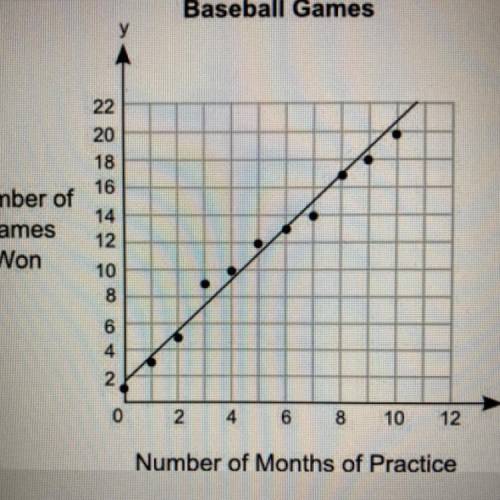
The graph shows the relationship between the number of months different students practiced baseball and the number of games they won:
Part A: What is the approximate y-intercept of the line of best fit and what does it represent? (5 points)
Part B: Write the equation for the line of best fit in slope-intercept form and use it to predict the number of games that could be won after 13 months of practice. Show your work and
include the points used to calculate the slope. (5 points)

Answers: 2


Other questions on the subject: Mathematics
Do you know the correct answer?
The graph shows the relationship between the number of months different students practiced baseball...
Questions in other subjects:
Mathematics, 21.05.2021 01:40
Mathematics, 21.05.2021 01:40

Mathematics, 21.05.2021 01:40

Mathematics, 21.05.2021 01:40


