


Select the correct answer.
Which statement is true about the graph of function ?
f(1) = log2<...

Mathematics, 09.03.2021 05:30, pennygillbert
Select the correct answer.
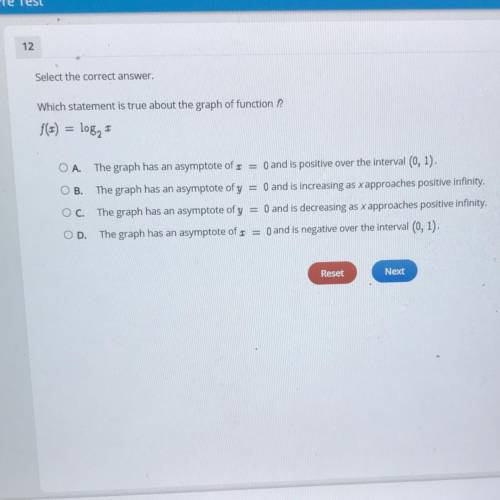
Which statement is true about the graph of function ?
f(1) = log2
O A. The graph has an asymptote of r = 0 and is positive over the interval (0, 1).
OB. The graph has an asymptote of y = 0 and is increasing as x approaches positive infinity.
OC. The graph has an asymptote of y = 0 and is decreasing as x approaches positive infinity.
OD. The graph has an asymptote of r = 0 and is negative over the interval (0, 1).

Answers: 2
Other questions on the subject: Mathematics
Mathematics, 21.06.2019 18:00, ineedhelp2285
Yesterday i ran 5 miles. today, i ran 3.7 miles. did my percent increase, decrease or is it a percent error? plz i need
Answers: 2
Mathematics, 21.06.2019 20:30, jmcd10
Create a question with this scenario you could ask that could be answered only by graphing or using logarithm. david estimated he had about 20 fish in his pond. a year later, there were about 1.5 times as many fish. the year after that, the number of fish increased by a factor of 1.5 again. the number of fish is modeled by f(x)=20(1.5)^x.
Answers: 1
Do you know the correct answer?
Questions in other subjects:
Mathematics, 20.10.2019 00:00

Health, 20.10.2019 00:00

Geography, 20.10.2019 00:00


History, 20.10.2019 00:00

Mathematics, 20.10.2019 00:00

Computers and Technology, 20.10.2019 00:00
Mathematics, 20.10.2019 00:00


