

Mathematics, 08.03.2021 21:20, jared3274
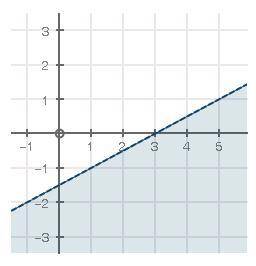
Which of the following inequalities is best represented by this graph? (1 point)
x − 2y > 3
x − 2y < 3
2x − y > 3
2x − y < 3

Answers: 3


Other questions on the subject: Mathematics
Mathematics, 22.06.2019 02:00, kayleahwilliams6
The line plot below represents the number of letters written to overseas pen pals by the students at the waverly middle school. each x represents 10 students. how many students wrote more than 6 and fewer than 20 letters. a.250 b.240 c.230 d.220
Answers: 1
Mathematics, 22.06.2019 02:30, Hippiekoolaid
How much is $1200 worth at the end of1 year, if the interest rate is 5.5% is compounded quarterly.
Answers: 1
Do you know the correct answer?
Which of the following inequalities is best represented by this graph? (1 point)
x − 2y > 3
Questions in other subjects:
Mathematics, 21.09.2019 14:30

Social Studies, 21.09.2019 14:30

Chemistry, 21.09.2019 14:30

Chemistry, 21.09.2019 14:30
Mathematics, 21.09.2019 14:30


