

Mathematics, 08.03.2021 19:30, BreBreDoeCCx
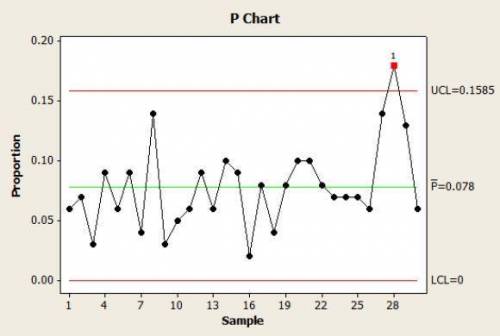
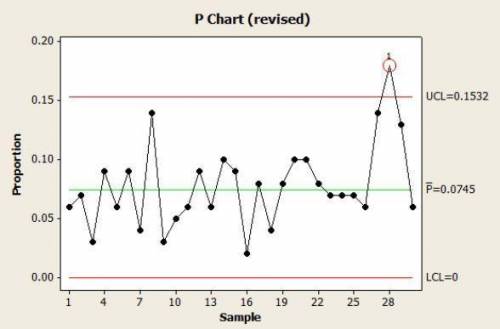
Suppose the following number of defects has been found in successive samples of size 100: 6, 7, 3, 9, 6, 9, 4, 14, 3, 5, 6, 9, 6, 10, 9, 2, 8, 4, 8, 10, 10, 8, 7, 7, 7, 6, 14, 18, 13, 6.
a. Using all the data, compute trial control limits for a fraction-defective control chart, construct the chart, and plot the data.
b. Determine whether the process is in statistical control. If not, assume that assignable causes can be found and out of- control points eliminated.

Answers: 1


Other questions on the subject: Mathematics
Mathematics, 21.06.2019 17:30, nurmukhammada
Can someone me with this problem i don't understand i need
Answers: 2
Do you know the correct answer?
Suppose the following number of defects has been found in successive samples of size 100: 6, 7, 3, 9...
Questions in other subjects:
Mathematics, 12.06.2021 16:50


Computers and Technology, 12.06.2021 16:50

Arts, 12.06.2021 16:50

Geography, 12.06.2021 16:50

Physics, 12.06.2021 16:50


