

Mathematics, 08.03.2021 18:10, ashleypere99
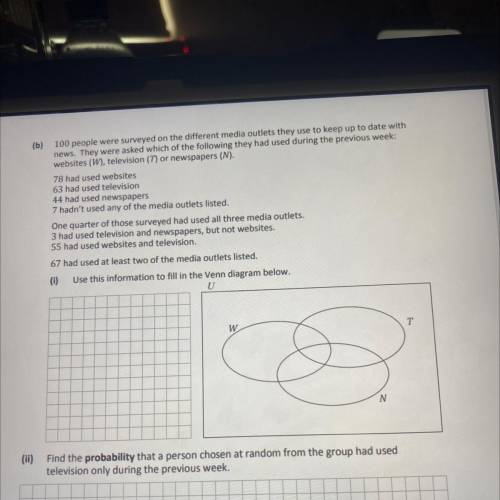
(b) 100 people were surveyed on the different media outlets they use to keep up to date with
news. They were asked which of the following they had used during the previous week:
websites (W), television (7) or newspapers (N).
78 had used websites
63 had used television
44 had used newspapers
7 hadn't used any of the media outlets listed.
One quarter of those surveyed had used all three media outlets.
3 had used television and newspapers, but not websites.
55 had used websites and television.
67 had used at least two of the media outlets listed.
(1) Use this information to fill in the Venn diagram below.
U
w
T
N

Answers: 1


Other questions on the subject: Mathematics
Mathematics, 21.06.2019 20:00, carltonwashington23
The midpoints of the sides of the large square are joined to form a smaller square. what is the area of the smaller square
Answers: 1
Mathematics, 21.06.2019 23:30, 20lap01
(c) compare the results of parts (a) and (b). in general, how do you think the mode, median, and mean are affected when each data value in a set is multiplied by the same constant? multiplying each data value by the same constant c results in the mode, median, and mean increasing by a factor of c. multiplying each data value by the same constant c results in the mode, median, and mean remaining the same. multiplying each data value by the same constant c results in the mode, median, and mean decreasing by a factor of c. there is no distinct pattern when each data value is multiplied by the same constant. (d) suppose you have information about average heights of a random sample of airline passengers. the mode is 65 inches, the median is 72 inches, and the mean is 65 inches. to convert the data into centimeters, multiply each data value by 2.54. what are the values of the mode, median, and mean in centimeters? (enter your answers to two decimal places.) mode cm median cm mean cm in this problem, we explore the effect on the mean, median, and mode of multiplying each data value by the same number. consider the following data set 7, 7, 8, 11, 15. (a) compute the mode, median, and mean. (enter your answers to one (1) decimal places.) mean value = median = mode = (b) multiply 3 to each of the data values. compute the mode, median, and mean. (enter your answers to one (1) decimal places.) mean value = median = mode = --
Answers: 1
Do you know the correct answer?
(b) 100 people were surveyed on the different media outlets they use to keep up to date with
news....
Questions in other subjects:


Mathematics, 13.07.2021 14:00


Social Studies, 13.07.2021 14:00

English, 13.07.2021 14:00
English, 13.07.2021 14:00
Mathematics, 13.07.2021 14:00


