

Mathematics, 08.03.2021 06:20, cmarton30140
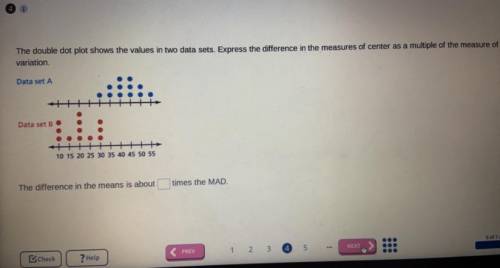
The double dot plot shows the values in two data sets. Express the difference in the measures of center as a multiple of the measure of
variation
Data set A
Data set B
..
10 15 20 25 30 35 40 45 50 55
The difference in the means is about
times the MAD

Answers: 1


Other questions on the subject: Mathematics
Mathematics, 21.06.2019 18:10, kingbob101
Drag the tiles to the boxes to form correct pairs. not all tiles will be used. match each set of vertices with the type of quadrilateral they form.
Answers: 1
Mathematics, 21.06.2019 19:00, miguelc2145
Give me the equations of two lines that have the same slope but are not parallel.
Answers: 3
Mathematics, 21.06.2019 19:00, coryowens44
Write a fraction less than 1, which has a denominator of 6 and is greater than 3/4 plz answer !
Answers: 1
Do you know the correct answer?
The double dot plot shows the values in two data sets. Express the difference in the measures of cen...
Questions in other subjects:


History, 11.10.2019 21:10

Social Studies, 11.10.2019 21:10


