

Mathematics, 04.03.2021 23:20, Legrand4423
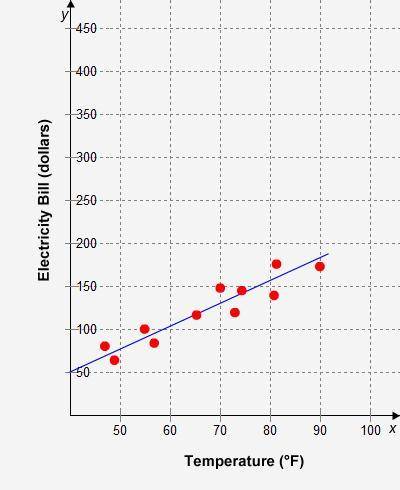
The line of best fit for this scatter plot shows the relationship between the average temperature and the monthly electricity bill at Jenny’s house. The electricity bill will be about $_ when the average temperature reaches 100°F.

Answers: 3


Other questions on the subject: Mathematics
Mathematics, 22.06.2019 00:00, lilacastro
The width of a rectangle is half as long as the length. the rectangle has an area of 18 square feet. what are the length and width of the rectangle?
Answers: 1
Do you know the correct answer?
The line of best fit for this scatter plot shows the relationship between the average temperature an...
Questions in other subjects:

Business, 19.03.2021 03:10
Mathematics, 19.03.2021 03:10
Mathematics, 19.03.2021 03:10


Mathematics, 19.03.2021 03:10


History, 19.03.2021 03:10


