

Mathematics, 26.08.2019 15:10, inucornspineapple
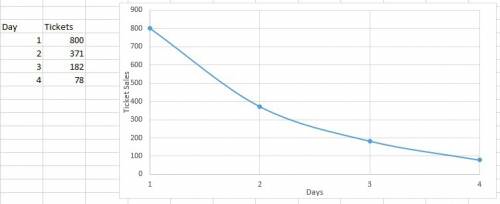
Aschool is keeping track of the number of tickets remaining for its year-end festival. the table shows the number of sales for the first, second, third, and fourth weeks of the month leading up to the festival. which graph could represent the data shown in the table?
day tickets 1 | 800 2 | 371 3 | 182 4 | 78 explain. i am not sure how to solve these. so much!

Answers: 2


Other questions on the subject: Mathematics
Mathematics, 21.06.2019 17:30, hailscooper7363
Simplify this expression.2(10) + 2(x – 4) a. 2x + 16 b. x + 12 c. 2x + 12 d. x + 16
Answers: 2
Mathematics, 22.06.2019 01:00, LuisBanuelos000
Arestaurant offers delivery for their pizzas. the total cost the customer pays is the price of the pizzas, plus a delivery fee. one customer pays $23 to have 2 pizzas delivered. another customer pays $59 for 6 pizzas. how many pizzas are delivered to a customer who pays $86?
Answers: 1
Do you know the correct answer?
Aschool is keeping track of the number of tickets remaining for its year-end festival. the table sho...
Questions in other subjects:

History, 03.03.2020 21:23
History, 03.03.2020 21:23
Mathematics, 03.03.2020 21:23

History, 03.03.2020 21:23


Geography, 03.03.2020 21:23


