

Mathematics, 03.03.2021 06:20, kendarriuskj1990
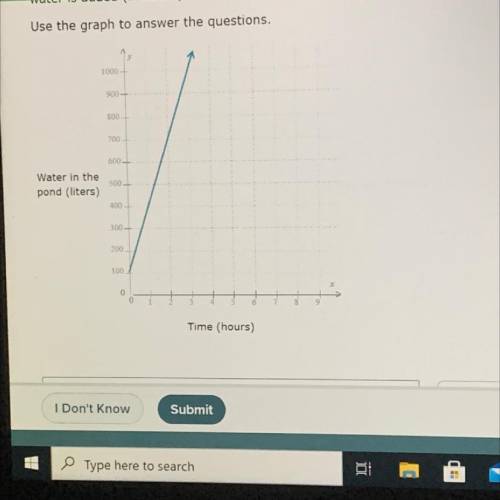
Owners of a recreation area are adding water to a pond. The graph below shows the amount of water in the pond (in liters) versus the amount of time that
water is added (in hours).
Use the graph to answer the questions.
Question is (a)- How much does the amount of water increase for each hour that water added - liters. (b)-what is the slope of the line

Answers: 3


Other questions on the subject: Mathematics
Mathematics, 21.06.2019 20:20, rleiphart1
Which of the following values are in the range of the function graphed below? check all that apply ! - will give the answer "brainliest! "
Answers: 1
Do you know the correct answer?
Owners of a recreation area are adding water to a pond. The graph below shows the amount of water in...
Questions in other subjects:


Mathematics, 25.10.2019 19:43


