


Ugly graph f(x)=-|x - 2+ 3
Now graph f(x) = 3/x|
Finally graph (x)- $
2
2
...

Mathematics, 02.03.2021 22:00, toxsicity
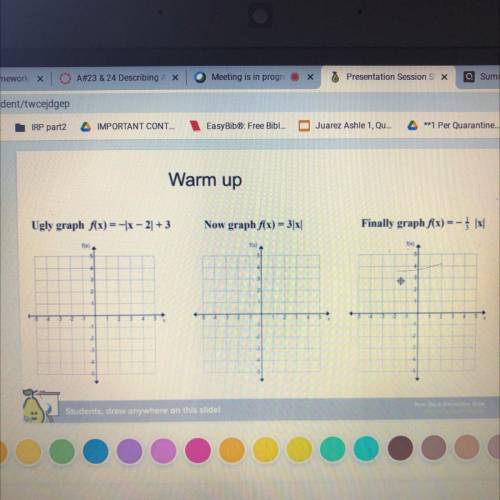
Ugly graph f(x)=-|x - 2+ 3
Now graph f(x) = 3/x|
Finally graph (x)- $
2
2
2
2
13

Answers: 1
Other questions on the subject: Mathematics
Mathematics, 21.06.2019 21:50, elsauceomotho
Which value of y will make the inequality y< -1 false?
Answers: 2
Mathematics, 22.06.2019 01:30, malikbryant2002
At store a, erasers are sold individually. the cost y of x erasers is represented by the equation y=0.75x. the costs of erasers at store b are shown in the graph.
Answers: 2
Mathematics, 22.06.2019 03:00, dominiqueallen23
Describe how the presence of possible outliers might be identified on the following. (a) histograms gap between the first bar and the rest of bars or between the last bar and the rest of bars large group of bars to the left or right of a gap higher center bar than surrounding bars gap around the center of the histogram higher far left or right bar than surrounding bars (b) dotplots large gap around the center of the data large gap between data on the far left side or the far right side and the rest of the data large groups of data to the left or right of a gap large group of data in the center of the dotplot large group of data on the left or right of the dotplot (c) stem-and-leaf displays several empty stems in the center of the stem-and-leaf display large group of data in stems on one of the far sides of the stem-and-leaf display large group of data near a gap several empty stems after stem including the lowest values or before stem including the highest values large group of data in the center stems (d) box-and-whisker plots data within the fences placed at q1 â’ 1.5(iqr) and at q3 + 1.5(iqr) data beyond the fences placed at q1 â’ 2(iqr) and at q3 + 2(iqr) data within the fences placed at q1 â’ 2(iqr) and at q3 + 2(iqr) data beyond the fences placed at q1 â’ 1.5(iqr) and at q3 + 1.5(iqr) data beyond the fences placed at q1 â’ 1(iqr) and at q3 + 1(iqr)
Answers: 1
Do you know the correct answer?
Questions in other subjects:


Geography, 28.09.2019 12:00

Chemistry, 28.09.2019 12:00

Physics, 28.09.2019 12:00
Mathematics, 28.09.2019 12:00
Mathematics, 28.09.2019 12:00


