

Mathematics, 01.03.2021 18:20, irene1806
NEED HELP WITH PART B ASAP!
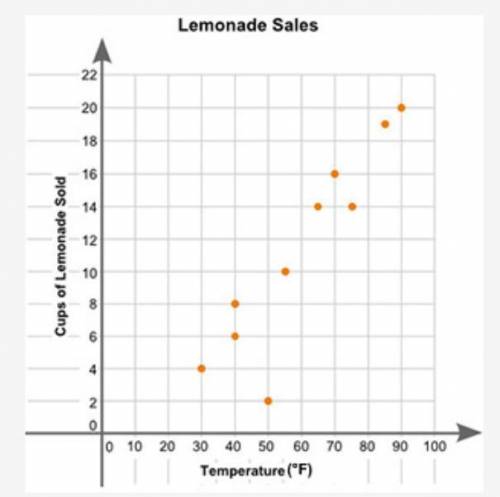
(06.02)Eric plotted the graph below to show the relationship between the temperature of his city and the number of cups of lemonade he sold daily:
A scatter plot is shown with the title Lemonade Sales. The x-axis is labeled High Temperature, and the y-axis is labeled Cups of Lemonade Sold. Data points are located at 30 and 4, 40 and 6, 40 and 8, 50 and 2, 55 and 10, 65 and 14, 70 and 16, 75 and 14, 85 and 19, 90 and 20.
Part A: Describe the relationship between the temperature of the city and the number of cups of lemonade sold. (2 points)
Part B: Describe how you can make the line of best fit. Write the approximate slope and y-intercept of the line of best fit. Show your work, including the points that you use to calculate the slope and y-intercept. (3 points)

Answers: 2


Other questions on the subject: Mathematics
Mathematics, 21.06.2019 15:00, jonesromari
What are the constants in this expression? -10.6+9/10+2/5m-2.4n+3m
Answers: 3
Mathematics, 21.06.2019 17:30, anonymous1813
Using the side-splitter theorem, daniel wrote a proportion for the segment formed by luke segment de. what is ec?
Answers: 3
Mathematics, 21.06.2019 17:30, grangian06
How many $20 bills do you need to have to make $280
Answers: 2
Mathematics, 21.06.2019 17:40, cifjdhhfdu
Aregular hexagon has sides of 2 feet. what is the area of the hexagon? 12 ft2 12 ft2 24 ft2 6 ft2
Answers: 2
Do you know the correct answer?
NEED HELP WITH PART B ASAP!
(06.02)Eric plotted the graph below to show the relationship between th...
Questions in other subjects:


Mathematics, 02.03.2020 05:30

Spanish, 02.03.2020 05:30

Health, 02.03.2020 05:30


