Mathematics, 27.02.2021 22:20, kloey908
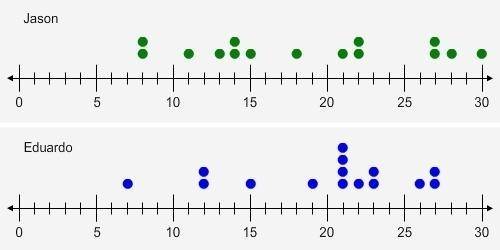
The dot plot shows the number of points scored by Jason and Eduardo during a middle school basketball season. Based on the dot plot, which statement about the medians and interquartile ranges of the data sets is true?
The difference of the medians is half the interquartile range of either data set.
The difference of the medians is one-fourth the interquartile range of either data set.
Their medians cannot be compared based on their interquartile ranges because the interquartile ranges are 9 points apart.
Their medians cannot be compared based on their interquartile ranges because the interquartile ranges are 6 points apart.


Answers: 3
Other questions on the subject: Mathematics

Mathematics, 21.06.2019 18:30, Snowinvain
An arc subtends a central angle measuring 7pi/4 radians what fraction of the circumference is this arc?
Answers: 1


Mathematics, 21.06.2019 20:00, ayoismeisalex
He weights of 2-pound bags of best dog food are approximately normally distributed with a given mean and standard deviation according to the empirical rule, what percentage of the bags will have weights within 3 standard deviations of the mean? 47.5%68%95%99.7%
Answers: 3
Do you know the correct answer?
The dot plot shows the number of points scored by Jason and Eduardo during a middle school basketbal...
Questions in other subjects:


