

Mathematics, 27.02.2021 04:40, umezinwachukwuebuka1
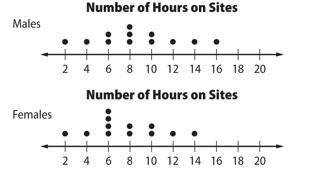
. The dot plot shows the number of hours students spent last week on social networking sites. Which is NOT an inference that can be made about the two populations?
A. Females typically spend more time than males on the sites.
B. Females typically spend less time than males on the sites.
C. The range for males is greater than the range for females.
D. The interquartile range for the males is 4 hours.

Answers: 3


Other questions on the subject: Mathematics
Mathematics, 21.06.2019 14:00, lovelysoul4698
You and a friend race across a field to a fence and back. your friend has a 50-meter head start. the equations shown represent you and your friend's distances dd (in meters) from the fence tt seconds after the race begins. find the time at which you catch up to your friend. you: d=∣−5t+100∣d=∣−5t+100∣ your friend: d=∣−313t+50∣∣
Answers: 2
Mathematics, 21.06.2019 21:10, Ahemingway7164
Mackenzie needs to determine whether the rectangles are proportional. which process could she use? check all that apply.
Answers: 1
Do you know the correct answer?
. The dot plot shows the number of hours students spent last week on social networking sites. Which...
Questions in other subjects:

History, 03.11.2021 22:40
Mathematics, 03.11.2021 22:40
Mathematics, 03.11.2021 22:40
Mathematics, 03.11.2021 22:40

English, 03.11.2021 22:40
Mathematics, 03.11.2021 23:00
Mathematics, 03.11.2021 23:00

Chemistry, 03.11.2021 23:10
History, 03.11.2021 23:10


