

Mathematics, 27.02.2021 04:40, hiiliohi6300
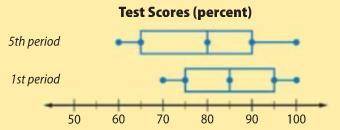
9. The double box plot shows the test scores for two different math classes. Use the information to determine which of the following inferences is NOT true.
A. Only one of the data sets is symmetric.
B. The median test score in 1st period is greater than 5th period.
C. The highest test score is the same in both periods.
D. The interquartile range of 1st period is larger than 5th period.

Answers: 2


Other questions on the subject: Mathematics
Mathematics, 21.06.2019 17:30, AzuraSchaufler
The graph below represents the number of dolphins in a dolphin sanctuary. select all the key features of this function.
Answers: 2
Mathematics, 21.06.2019 17:30, hwhite41
Is trapezoid abdc the result of a dilation of trapezoid mnpq by a scale factor of ? why or why not? yes, because ab and cd are each the lengths mn and qp. yes, because sides ab and cd are parallel to sides mn and qp. no, because ab is the length mn but cd is the length qp. no, because sides ab and cd have different slopes from sides mn and qp.
Answers: 1
Mathematics, 21.06.2019 23:10, jaylenmiller437
Astudent draws two parabolas on graph paper. both parabolas cross the x-axis at (–4, 0) and (6, 0). the y-intercept of the first parabola is (0, –12). the y-intercept of the second parabola is (0, –24). what is the positive difference between the a values for the two functions that describe the parabolas? write your answer as a decimal rounded to the nearest tenth
Answers: 2
Mathematics, 22.06.2019 03:00, vale2652
Which statement is true about the local minimum of the graphed function? over the interval[-4,-2], the local minimum is 0. over the interval [-2,-1] , the local minimum is 25. over the interval [-1,4], the local minimum is 0. over the interval [4,7], the local minimum is -7
Answers: 2
Do you know the correct answer?
9. The double box plot shows the test scores for two different math classes. Use the information to...
Questions in other subjects:

English, 07.01.2020 23:31
Mathematics, 07.01.2020 23:31


