

Mathematics, 26.02.2021 15:40, aaliyah80
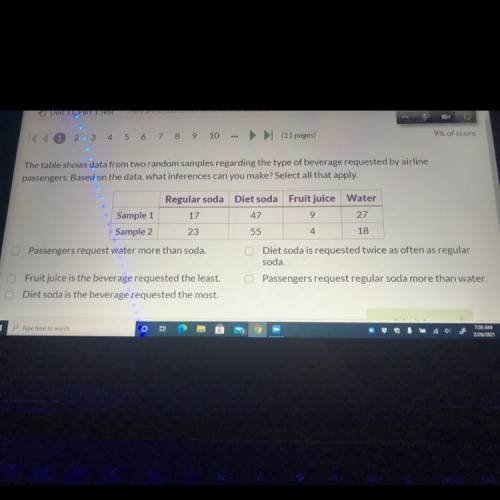
The table shows data from two random samples regarding the type of beverage requested by airline
passengers. Based on the data, what inferences can you make? Select all that apply.
Regular soda Diet soda Fruit juice Water
Sample 1 17
47
9
27
Sample 2 23
55
4
18
Passengers request water more than soda,
Diet soda is requested twice as often as regular
soda.
Fruit juice is the beverage requested the least. Passengers request regular soda more than water.
Diet soda is the beverage requested the most.

Answers: 3


Other questions on the subject: Mathematics
Mathematics, 21.06.2019 16:00, mpete1234567890
Which term best describes the association between variables a and b
Answers: 1
Mathematics, 22.06.2019 03:30, chrissycherry
Find the cocordinatse of the point on y axis which is nearest to the point (-2,5)
Answers: 2
Do you know the correct answer?
The table shows data from two random samples regarding the type of beverage requested by airline
pa...
Questions in other subjects:

Mathematics, 18.09.2019 00:30
Mathematics, 18.09.2019 00:30
Mathematics, 18.09.2019 00:30

History, 18.09.2019 00:30


Chemistry, 18.09.2019 00:30


