

Mathematics, 26.02.2021 03:40, izhaneedwards
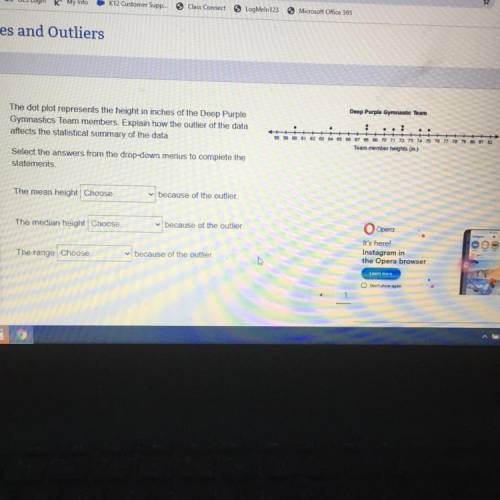
The dot plot represents the height in inches of the Deep Purple
Gymnastics Team members. Explain how the outlier of the data
affects the statistical summary of the data.
Select the answers from the drop-down menus to complete the
statements.
The mean height Choose...
because of the outlier.
The median height Choose...
because of the outlier.
The range Choose...
because of the outlier.

Answers: 3


Other questions on the subject: Mathematics
Mathematics, 21.06.2019 15:20, queentynaisa
Which is the equation of an ellipse with directrices at x = ±4 and foci at (2, 0) and (−2, 0)?
Answers: 3
Mathematics, 21.06.2019 15:30, 001234567891011
Abike shop sells you a bicycle for $63 and a helmet for $21. the total cost is 150% of what the shop spent originally. how much did the shop spend originally? how much profit did the bike shop earn by selling the bicycle and helmet to you ?
Answers: 1
Mathematics, 22.06.2019 00:00, HannaTheGurls
The volume of the a sphere whoes diameter is 18 cm is cubic cm . if it's diameter were reduced by half, it's volume would be of its original volume
Answers: 1
Do you know the correct answer?
The dot plot represents the height in inches of the Deep Purple
Gymnastics Team members. Explain ho...
Questions in other subjects:


