

Mathematics, 25.02.2021 23:40, blackwell0315
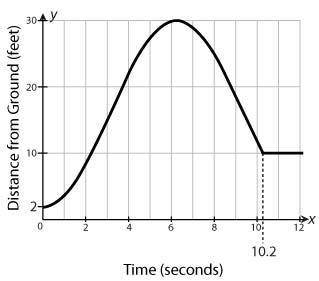
Ivan's position on a Ferris wheel is represented by the graph below where x is time in seconds and y is his distance from the ground. Which interpretations of the graph are true? Choose all that are correct.

Answers: 2


Other questions on the subject: Mathematics
Mathematics, 21.06.2019 16:00, blackwhiteroses383
Which graph represents the solution set for the given system of inequalities? x+2y< 3 x+y> 4 3x-2y> 4
Answers: 2
Mathematics, 21.06.2019 21:30, Diamondnado3046
What percent of 18 is 24? and plz explain thx.
Answers: 2
Mathematics, 21.06.2019 21:30, ajm1132005
Questions 9-10. use the table of educational expenditures to answer the questions. k-12 education expenditures population indiana $9.97 billion 6.6 million illinois $28.54 billion 12.9 million kentucky $6.58 billion 4.4 million michigan $16.85 billion 9.9 million ohio $20.23 billion 11.6million 9. if the amount of k-12 education expenses in indiana were proportional to those in ohio, what would have been the expected value of k-12 expenditures in indiana? (give the answer in billions rounded to the nearest hundredth) 10. use the value of k-12 education expenditures in michigan as a proportion of the population in michigan to estimate what the value of k-12 education expenses would be in illinois. a) find the expected value of k-12 expenditures in illinois if illinois were proportional to michigan. (give the answer in billions rounded to the nearest hundredth) b) how does this compare to the actual value for k-12 expenditures in illinois? (lower, higher, same? )
Answers: 1
Do you know the correct answer?
Ivan's position on a Ferris wheel is represented by the graph below where x is time in seconds and y...
Questions in other subjects:


Mathematics, 17.01.2020 10:31
History, 17.01.2020 10:31

Social Studies, 17.01.2020 10:31
Mathematics, 17.01.2020 10:31
Mathematics, 17.01.2020 10:31


