

Mathematics, 25.02.2021 19:50, xojade
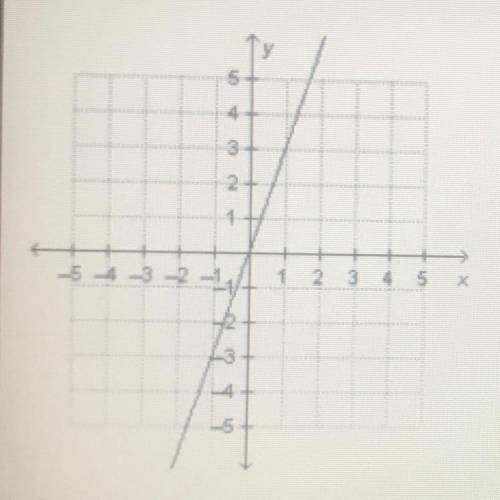
Which explains whether or not the graph represents a direct variation?
•The graph has a constant of variation of 3, so it represents a direct variation.
•The graph has a slope of 3, so it represents a direct variation
•The graph has a positive slope, so it does not represent a direct variation
•The graph does not beain at the origin so it does not represent a direct variation

Answers: 3


Other questions on the subject: Mathematics
Mathematics, 21.06.2019 14:40, jetblackcap
Iam trying to solve a linear equation for the shoe size of someone 84" tall taking into consideration example 1 is 69" tall with a shoe size of 9 and example 2 is 72 inches tall with a shoe size of 11. i understand that the equation should be y=mx+b and that on the graph the answer is (3,2) but i just don't understand how to create the equation to solve for 84-inches and 60-inches tall questions. after two days, i need .
Answers: 2
Mathematics, 21.06.2019 20:30, Cheyenne8694
Stacey filled her 1/2 cup of measuring cup seven times to have enough flour for a cake recipe how much flour does the cake recipe calls for
Answers: 2
Do you know the correct answer?
Which explains whether or not the graph represents a direct variation?
•The graph has a constant of...
Questions in other subjects:

Mathematics, 11.03.2021 01:40
Mathematics, 11.03.2021 01:40

History, 11.03.2021 01:40
Mathematics, 11.03.2021 01:40


