

Mathematics, 25.02.2021 08:20, tiffanyheist
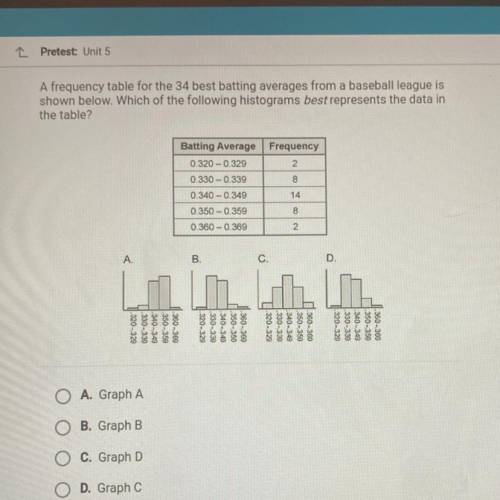
A frequency table for the 34 best batting averages from a baseball league is
shown below. Which of the following histograms best represents the data in
the table?
Frequency
2
Batting Average
0.320 -0.329
0.330 -0.339
0.340 -0.349
0.350 - 0.359
0.360 -0.369
0000
A.
B.
C.
.320-329
-330-339
1.340-349
.350-350
360-360
320-329
:330-339
.340-349
.350-359
.360-360
.320-329
-330-339
.340-349
.350 - 350
.360-360
-320-320
.330-339
340-349
350-350
.360-369
A. Graph A
B. Graph B
C. Graph D
O D. Graph C

Answers: 1


Other questions on the subject: Mathematics
Mathematics, 21.06.2019 20:30, talexander131
The difference between two numbers is one. three times the larger number minus two times the smaller number is 9. what are the two numbers
Answers: 3
Mathematics, 22.06.2019 00:00, crazylogic963
Charlie is at an amusement park that has 18 different rides. each ride costs $1.75. the function c(r) = 1.75r represents the total amount of money that charlie will spend if he goes on r rides, but he never goes on the same one more than once. what domain and range are reasonable for the function?
Answers: 3
Mathematics, 22.06.2019 00:40, leannaadrian
If a distance of 75 yds is measured back from the edge of the canyon and two angles are measured , find the distance across the canyon angle acb = 50° angle abc=100° a=75 yds what does c equal?
Answers: 1
Do you know the correct answer?
A frequency table for the 34 best batting averages from a baseball league is
shown below. Which of...
Questions in other subjects:

Mathematics, 19.10.2019 15:30

Biology, 19.10.2019 15:30

Physics, 19.10.2019 15:30
Mathematics, 19.10.2019 15:50

Chemistry, 19.10.2019 15:50
Mathematics, 19.10.2019 15:50


