

Mathematics, 25.02.2021 03:20, blaze9889t
LAST ONE THANKS
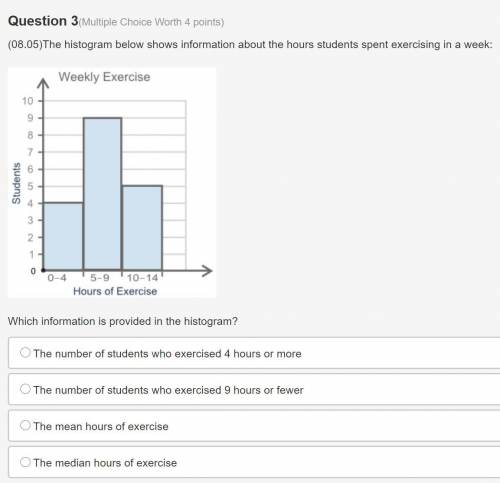
The histogram below shows information about the hours students spent exercising in a week:
A histogram is titled Weekly Exercise, the horizontal axis is labeled Hours of Exercise, and the vertical axis is labeled Students. The range on the horizontal axis is 0 to 4, 5 to 9, and 10 to 14. The values on the vertical axis are from 0 to 10 at intervals of 1. The first bin goes to 4, the second bin to 9, the third bin to 5.
Which information is provided in the histogram?
A:The number of students who exercised 4 hours or more
B: The number of students who exercised 9 hours or fewer
C:The mean hours of exercise
D:The median hours of exercise

Answers: 3


Other questions on the subject: Mathematics
Mathematics, 21.06.2019 15:00, 5924000264
Find parametric equations for the line tangent to the curve of intersection of the surfaces at the given point. surfaces: xsquared2plus+2yplus+2zequals=1212 yequals=33 point: left parenthesis 1 comma 3 comma five halves right parenthesis
Answers: 1
Mathematics, 21.06.2019 19:20, laidbackkiddo412
Find the area of an equilateral triangle with a side of 6 inches
Answers: 2
Mathematics, 21.06.2019 22:30, pedroramirezr2
What is the graph of the absolute value equation ? y=|x|-5
Answers: 1
Mathematics, 22.06.2019 04:50, tytybruce2
Use the chart to multiply the binomial by the trinomial. what is the product? y3 + 27 y3 – 27 y3 – 6y2 + 27 y3 + 6y2 + 27
Answers: 3
Do you know the correct answer?
LAST ONE THANKS
The histogram below shows information about the hours students spent exercising in...
Questions in other subjects:


Mathematics, 21.05.2021 16:50


Mathematics, 21.05.2021 16:50

Chemistry, 21.05.2021 16:50
Mathematics, 21.05.2021 16:50
Mathematics, 21.05.2021 16:50


