

Mathematics, 25.02.2021 01:00, shorty1619
Select the correct answer.
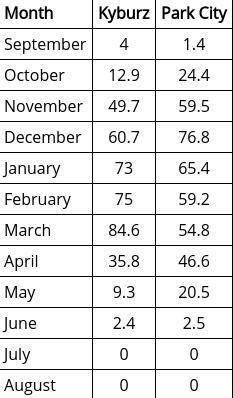
The table shows the monthly snowfall in Kyburz, California, and Park City, Utah.
What conclusion can you draw from the given data?
A. Because the interquartile range of the data for Kyburz is higher than the interquartile range of the data for Park City, the variability in the monthly snowfall is higher in Kyburz.
B. Because the interquartile range of the data for Kyburz is lower than the interquartile range of the data for Park City, the variability in the monthly snowfall is lower in Kyburz.
C. Because the mean of the monthly snowfall values in Kyburz is higher than the mean of the monthly snowfall values in Park City, the variability in the monthly snowfall is higher in Kyburz.
D. Because the mean of the monthly snowfall values in Kyburz is lower than the mean of the monthly snowfall values in Park City, the variability in the monthly snowfall is lower in Kyburz.

Answers: 1


Other questions on the subject: Mathematics
Mathematics, 21.06.2019 19:10, cottoncandy465
Asystem of equations has 1 solution. if 4x-y=5 is one of the equations , which could be the other equation ?
Answers: 1
Mathematics, 21.06.2019 20:00, brittanybyers122
Which type of graph would allow us to compare the median number of teeth for mammals and reptiles easily
Answers: 2
Do you know the correct answer?
Select the correct answer.
The table shows the monthly snowfall in Kyburz, California, and Park Cit...
Questions in other subjects:
Mathematics, 11.10.2020 20:01


Mathematics, 11.10.2020 20:01

Chemistry, 11.10.2020 20:01


Mathematics, 11.10.2020 20:01


