


Each length with this mark is
(I) is 36 inches
(II) is 18 inches
(III) is 30 inches
...

Mathematics, 24.02.2021 04:00, Savadt2810
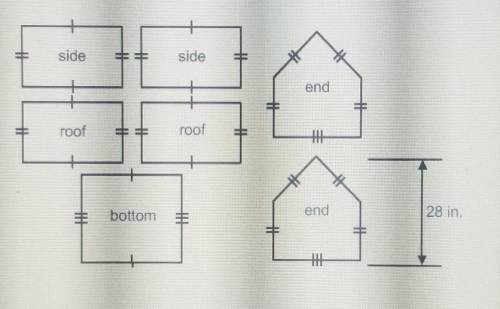
Each length with this mark is
(I) is 36 inches
(II) is 18 inches
(III) is 30 inches
Each end has a height (from the highest point to the lowest point) of 28 inches.
Part A
If Wendell were to slice the doghouse in half with a slice parallel to the pentagonal bases, what shape would the slice be?
Part B
If Wendell were to slice the doghouse with a plane parallel to the two sides through any section of the doghouse, what shape would the slice be?
Part C If Wendell were to slice the doghouse with a plane parallel to the bottom through any section of the doghouse, what shape would the slice be?
Part D
Wendell plans to paint the doghouse after it's built. He wants to know what the surface area of the outside of the doghouse will be. To find the surface area, rst break up any composite shapes into rectangles and triangles. Which shape is considered a composite shape? When the shape is decomposed, what are the dimensions of the resulting shapes necessary for finding surface area?
Part E
Using the results from part D and the dimensions of the other surfaces, find the surface area of the outside of the doghouse. Be sure to include the bottom surface in your calculation.
Part F.
Wendell is curious how much space Jordan will have inside the doghouse to move around in. What is the volume of the doghouse?

Answers: 2
Other questions on the subject: Mathematics
Mathematics, 21.06.2019 20:00, faithyholcomb
Someone answer asap for ! max recorded the heights of 500 male humans. he found that the heights were normally distributed around a mean of 177 centimeters. which statements about max’s data must be true? a. the median of max’s data is 250 b. more than half of the data points max recorded were 177 centimeters. c. a data point chosen at random is as likely to be above the mean as it is to be below the mean. d. every height within three standard deviations of the mean is equally likely to be chosen if a data point is selected at random.
Answers: 1
Mathematics, 21.06.2019 21:00, animexcartoons209
With alll of except for the 2 that i did already
Answers: 1
Mathematics, 21.06.2019 22:20, dontworry48
Which graph represents the given linear function 4x+2y=3
Answers: 1
Do you know the correct answer?
Questions in other subjects:


Health, 18.07.2019 12:30
Mathematics, 18.07.2019 12:30

Mathematics, 18.07.2019 12:30
Mathematics, 18.07.2019 12:30


