

Mathematics, 23.02.2021 19:40, kathlynskare06
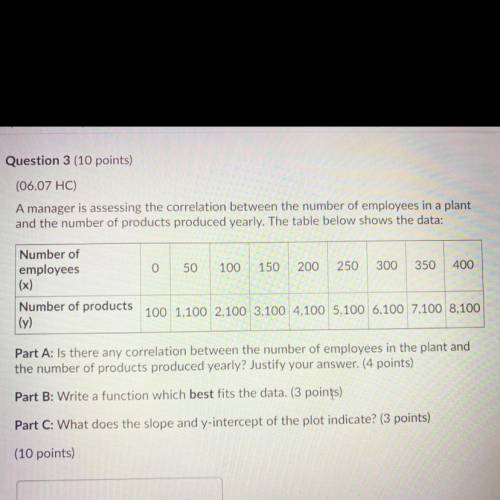
A manager is assessing the correlation between the number of employees in a plant
and the number of products produced yearly. The table below shows the data:
Number of
employees
(x)
0
50
100
150
200
250
300
350
400
Number of products
(y)
100 1,100 2,100 3,100 4,100 5,100 6,100 7,100 8,100
Part A: Is there any correlation between the number of employees in the plant and
the number of products produced yearly? Justify your answer. (4 points)
Part B: Write a function which best fits the data. (3 points)
Part C: What does the slope and y-intercept of the plot indicate? (3 points)

Answers: 3


Other questions on the subject: Mathematics
Mathematics, 21.06.2019 21:00, asiamuhammad6
Rewrite the following quadratic functions in intercept or factored form. show your work. y = 4x^2 - 19x- 5
Answers: 2
Mathematics, 21.06.2019 23:30, fonzocoronado3478
Answer each of the questions for the following diagram: 1. what type of angles are these? 2. solve for x. what does x equal? 3. what is the measure of the angles?
Answers: 1
Do you know the correct answer?
A manager is assessing the correlation between the number of employees in a plant
and the number of...
Questions in other subjects:
Mathematics, 19.07.2019 02:30


Social Studies, 19.07.2019 02:30
Mathematics, 19.07.2019 02:30

Health, 19.07.2019 02:30


Business, 19.07.2019 02:30


