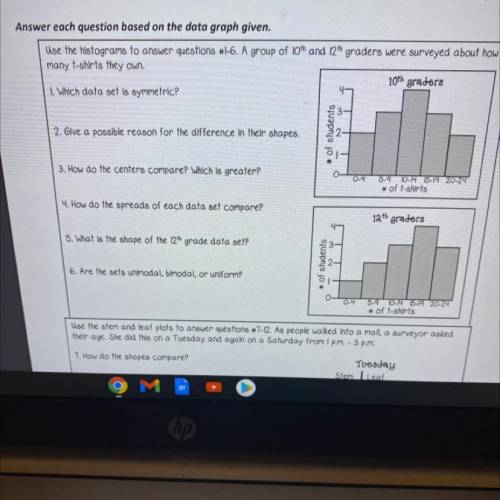
I need help with the graph I don’t I understand it
...

Answers: 1
Other questions on the subject: Mathematics

Mathematics, 21.06.2019 17:30, Serenitybella
Which are factor pairs of 350? choose all answers that are correct. a) 30 and 12 b) 35 and 10 c) 70 and 5 d) 2 and 125
Answers: 2


Mathematics, 22.06.2019 00:30, sanfordl
1. according to the internal revenue service, the mean tax refund for the year 2007 was $2,708. assume the standard deviation is $650 and that the amounts refunded follow a normal probability distribution. a. what percent of the refunds are more than $3,000? b. what percent of the refunds are more than $3,000 but less than $4,000? c. what percent of the refunds are less than $2,000?
Answers: 2

Mathematics, 22.06.2019 01:30, hela9astrid
This graph shows a portion of an odd function. use the graph to complete the table of values. x f(x) −2 −3 −4 −6 im sorry i cant get the graph up
Answers: 1
Do you know the correct answer?
Questions in other subjects:


Social Studies, 11.07.2019 00:30


Mathematics, 11.07.2019 00:30

History, 11.07.2019 00:30


