

Mathematics, 23.02.2021 01:00, anniejordan0412
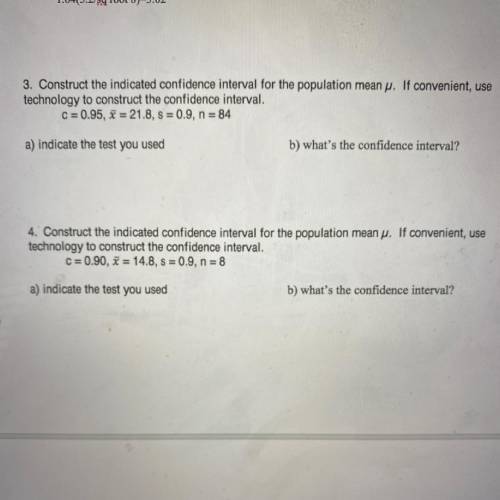
Construct the indicated confidence interval for the population mean “mu”. c=0.90 mean=12.8, s=0.9, n=8. please help me solve and explain if possible!

Answers: 3


Other questions on the subject: Mathematics
Mathematics, 21.06.2019 14:00, kah36
When drawing a trend line for a series of data on a scatter plot, which of the following is true? a. there should be an equal number of data points on either side of the trend line. b. all the data points should lie on one side of the trend line. c. the trend line should not intersect any data point on the plot. d. the trend line must connect each data point on the plot.
Answers: 2
Mathematics, 21.06.2019 14:00, payloo
Alex drew a circle with right triangle prq inscribed in it, as shown below: the figure shows a circle with points p, q, and r on it forming an inscribed triangle. side pq is a chord through the center and angle r is a right angle. arc qr measures 80 degrees.
Answers: 2
Mathematics, 21.06.2019 16:00, aidengalvin20
Plz i beg u asap ! what is the equation of this graphed line? enter your answer in slope-intercept form in the box.
Answers: 2
Do you know the correct answer?
Construct the indicated confidence interval for the population mean “mu”. c=0.90 mean=12.8, s=0.9, n...
Questions in other subjects:
Mathematics, 18.09.2020 17:01
Mathematics, 18.09.2020 18:01
Mathematics, 18.09.2020 18:01
Mathematics, 18.09.2020 18:01
Mathematics, 18.09.2020 18:01
Mathematics, 18.09.2020 18:01

English, 18.09.2020 18:01
Mathematics, 18.09.2020 18:01
Mathematics, 18.09.2020 18:01
Mathematics, 18.09.2020 18:01


