

Mathematics, 22.02.2021 09:00, juli8350
I NEED HELP NOW
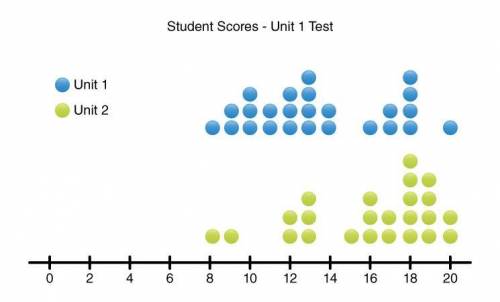
The following dot plot represents student scores on both the Unit 1 and Unit 2 math tests. Scores are in whole number increments.
Part 1: Looking at the data plots, which test do you think the students scored better on? Do you think one of the tests has more variation than the other or is the variation about the same for both tests? Use complete sentences in your answer and explain your reasoning.
Part 2: Calculate the mean (rounded to the nearest whole number) and mean absolute deviation for the Unit 1 test.
Part 3: Do your results from part B prove or disprove your hypotheses from part A? Use complete sentences in your answer and explain your reasoning.

Answers: 2


Other questions on the subject: Mathematics
Mathematics, 21.06.2019 18:00, lpssprinklezlps
George has seven boxes of five pencils. giulio three boxes of eight pencils. one of the boys arranges all his pencils equally into two groups. was this george or giulio how many are in each group explain
Answers: 1
Mathematics, 21.06.2019 20:30, faizanaj1192
Raymond just got done jumping at super bounce trampoline center. the total cost of his session was $43.25 . he had to pay a $7 entrance fee and $1.25 for every minute he was on the trampoline. write an equation to determine the number of minutes (t) that raymond was on the trampoline.
Answers: 1
Mathematics, 21.06.2019 22:30, sanociahnoel
Ibeg you to me 20. a reaction produces 4.93 l of oxygen, but was supposed to produce 1 mol of oxygen. what is the percent yield?
Answers: 3
Mathematics, 21.06.2019 23:30, axelgonzalez9999
Segment wx is shown explain how you would construct a perpendicular bisector of wx using a compass and a straightedge
Answers: 1
Do you know the correct answer?
I NEED HELP NOW
The following dot plot represents student scores on both the Unit 1 and Unit 2 math...
Questions in other subjects:


History, 03.12.2020 21:40

Mathematics, 03.12.2020 21:40

Engineering, 03.12.2020 21:40
Mathematics, 03.12.2020 21:40


