

Mathematics, 21.02.2021 20:20, Thatweirdgirly5
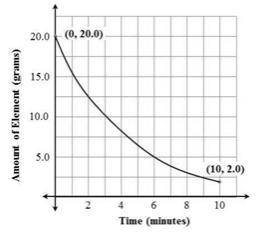
The graph models the amount of radioactive element present over the course of a 10-minute experiment.
What is the average rate of change of the amount of the element over the 10-minute experiment?
A. -2.0 g/min
B. -1.8 g/min
C. -0.2 g/min
D. -5.0 g/min

Answers: 3


Other questions on the subject: Mathematics
Mathematics, 21.06.2019 15:20, emmanuel180
Can (3,5 and square root 34) be sides on a right triangle?
Answers: 1
Mathematics, 21.06.2019 17:30, cxttiemsp021
Is appreciated! graph the functions and approximate an x-value in which the exponential function surpasses the polynomial function. f(x) = 4^xg(x) = 4x^2options: x = -1x = 0x = 1x = 2
Answers: 1
Mathematics, 21.06.2019 17:40, cifjdhhfdu
Aregular hexagon has sides of 2 feet. what is the area of the hexagon? 12 ft2 12 ft2 24 ft2 6 ft2
Answers: 2
Mathematics, 21.06.2019 18:30, sakria2002
What can each term of the equation be multiplied by to eliminate the fractions before solving? x – + 2x = + x 2 6 10 12
Answers: 1
Do you know the correct answer?
The graph models the amount of radioactive element present over the course of a 10-minute experiment...
Questions in other subjects:

History, 23.07.2020 19:01


World Languages, 23.07.2020 19:01


