

Mathematics, 21.02.2021 06:50, kev9369
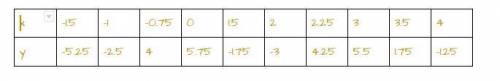
Can I get some help with this please I have an F for a grade in this class and I really need to try to bring it up. Draw a scatter plot of the data. Tell whether the data has a positive, negative or approximately no correlation.

Answers: 1


Other questions on the subject: Mathematics
Mathematics, 21.06.2019 20:30, oliwia0765
Solve each quadratic equation by factoring and using the zero product property. x^2 + 18x = 9x
Answers: 2
Mathematics, 21.06.2019 22:00, joelpimentel
3women sell hats at a craft fair weekly. the money they make at the fair is split into categories. 9% goes to pay taxes. $55 goes to pay rent for the space they sell in. the rest is split between the women. if the group make $706 at the fair, how much does each women get paid once the money is divided
Answers: 1
Mathematics, 21.06.2019 23:30, reycaden
The number of members f(x) in a local swimming club increased by 30% every year over a period of x years. the function below shows the relationship between f(x) and x: f(x) = 10(1.3)xwhich of the following graphs best represents the function? graph of f of x equals 1.3 multiplied by 10 to the power of x graph of exponential function going up from left to right in quadrant 1 through the point 0, 0 and continuing towards infinity graph of f of x equals 10 multiplied by 1.3 to the power of x graph of f of x equals 1.3 to the power of x
Answers: 1
Do you know the correct answer?
Can I get some help with this please I have an F for a grade in this class and I really need to try...
Questions in other subjects:


English, 19.05.2020 16:22
Mathematics, 19.05.2020 16:22
Mathematics, 19.05.2020 16:22
Mathematics, 19.05.2020 16:22
Mathematics, 19.05.2020 16:22


