

Mathematics, 20.02.2021 09:00, shoreelinee1337
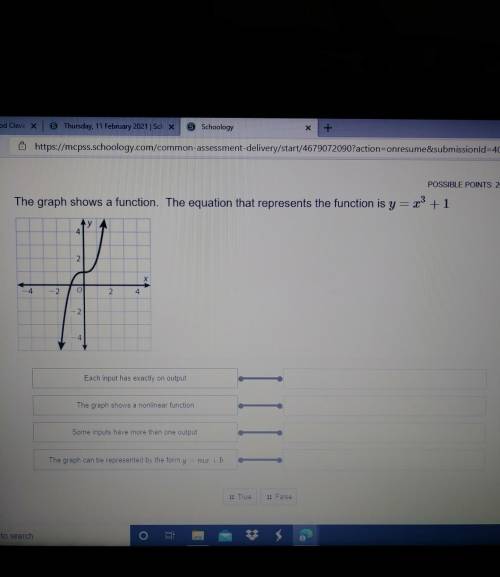
Help Me, Now ASAP! The graph shows a function. The equation that represents the function is y = x3 + 1.
True Or False?
Each input has exactly on out put
The graph shows a nonlinear function
Some inputs have more than one output.
The graph can be represented. by the form y = mx + b

Answers: 2


Other questions on the subject: Mathematics
Mathematics, 21.06.2019 14:30, TheCampingStone
The sum of two numbers is 58. the first number is 8 less than half the second number. let c represent the first number. let drepresent the second number. which statements about solving for the two numbers are true? check all that apply. the equation  represents the sum of the two numbers. the equation  represents the sentence “the first number is 8 less than half the second number.”the equation  represents the relationship between the two numbers. the equation  represents the sum of the two numbers. the number d is 14.the number c is 44.the number c is 14.the number d is 44.
Answers: 1
Mathematics, 21.06.2019 17:30, bradleycawley02
Lems1. the following data set represents the scores on intelligence quotient(iq) examinations of 40 sixth-grade students at a particular school: 114, 122, 103, 118, 99, 105, 134, 125, 117, 106, 109, 104, 111, 127,133, 111, 117, 103, 120, 98, 100, 130, 141, 119, 128, 106, 109, 115,113, 121, 100, 130, 125, 117, 119, 113, 104, 108, 110, 102(a) present this data set in a frequency histogram.(b) which class interval contains the greatest number of data values? (c) is there a roughly equal number of data in each class interval? (d) does the histogram appear to be approximately symmetric? if so, about which interval is it approximately symmetric?
Answers: 3
Mathematics, 21.06.2019 20:30, violetagamez2
Answer for 10 points show work you guys in advanced < 3
Answers: 1
Do you know the correct answer?
Help Me, Now ASAP! The graph shows a function. The equation that represents the function is y = x3 +...
Questions in other subjects:

English, 06.05.2021 23:10
English, 06.05.2021 23:10

Social Studies, 06.05.2021 23:10

Mathematics, 06.05.2021 23:10


Business, 06.05.2021 23:10

French, 06.05.2021 23:10


