


(06.04 MC)
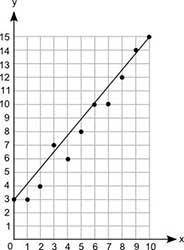
Suzie drew the line of best fit on the scatter plot shown.
A graph is shown...

Mathematics, 18.02.2021 20:40, jennnifercrd59jc
(06.04 MC)
Suzie drew the line of best fit on the scatter plot shown.
A graph is shown with scale along x axis from 0 to 10 at increments of 1 and scale along y axis from 0 to 15 at increments of 1. The ordered pairs 0, 3 and 1, 3 and 2, 4 and 3, 7 and 4, 6 and 5, 8 and 6, 10 and 7, 10 and 8, 12 and 9, 14 and 10, 15 are shown on the graph. A straight line joins the ordered pairs 0, 3 and 10, 15.
What is the approximate equation of this line of best fit in slope-intercept form?
y = 6 over 5x + 3
y = 3x + 6 over 5
y = 5 over 6x + 3
y = 3x + 5 over 6

Answers: 2
Other questions on the subject: Mathematics
Mathematics, 21.06.2019 21:10, samiam61
Which question is not a good survey question? a. don't you agree that the financial crisis is essentially over? 63on average, how many hours do you sleep per day? c. what is your opinion of educational funding this year? d. are you happy with the availability of electronic products in your state?
Answers: 2
Mathematics, 21.06.2019 23:00, johnsonkia873
Find the rate at which the water is now flowing from the tap give your answer cubic centimetres per second
Answers: 1
Mathematics, 21.06.2019 23:30, meiyrarodriguez
Write an inequality for this sentence the quotient of a number and -5 increased by 4 is at most 8
Answers: 1
Do you know the correct answer?
Questions in other subjects:

English, 26.03.2020 05:26

French, 26.03.2020 05:26

Biology, 26.03.2020 05:27

History, 26.03.2020 05:27
Mathematics, 26.03.2020 05:27


