

Mathematics, 18.02.2021 20:50, jerz3151
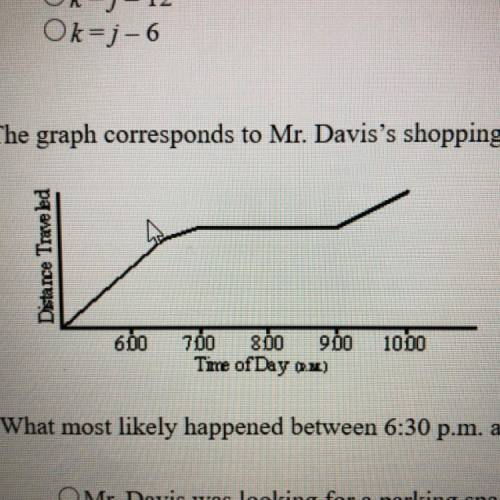
12. The graph corresponds to Mr. Davis's shopping trip to a mall by car. (1 point)
What most likely happened between 6:30 p. m. and 7:00 p. m.?
A.) Mr. Davis was looking for a parking space.
B.) Mr. Davis got tired and went home.
C.) Mr. Davis was at the mall shopping.
D.) Mr. Davis backed out of his driveway.

Answers: 3


Other questions on the subject: Mathematics
Mathematics, 21.06.2019 18:00, briseidam6683
Suppose sat writing scores are normally distributed with a mean of 497 and a standard deviation of 109. a university plans to award scholarships to students whose scores are in the top 2%. what is the minimum score required for the scholarship? round your answer to the nearest whole number, if necessary.
Answers: 2
Mathematics, 21.06.2019 19:30, jasminetaylor4587
According to the data set, where should the upper quartile line of the box plot be placed?
Answers: 1
Mathematics, 21.06.2019 23:00, Tyrant4life
If t8 = 4 and t12 = −2, find the first three terms of the arithmetic sequence.
Answers: 1
Do you know the correct answer?
12. The graph corresponds to Mr. Davis's shopping trip to a mall by car. (1 point)
What most likely...
Questions in other subjects:

Mathematics, 21.12.2020 20:30

Mathematics, 21.12.2020 20:30
Mathematics, 21.12.2020 20:30
Mathematics, 21.12.2020 20:30


