


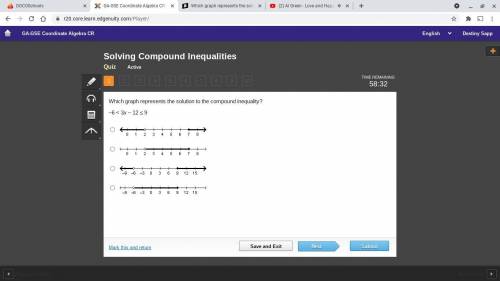
Which graph represents the solution to the compound inequality?
–6 < 3x – 12 ≤ 9
A n...

Mathematics, 17.02.2021 22:00, alexander1093
Which graph represents the solution to the compound inequality?
–6 < 3x – 12 ≤ 9
A number line with an open circle at 2 with a bold line pointing to the left. A point at 7 with a bold line pointing to the right.
A number line with an open circle at 2 with a bold line pointing to the right ending at the point at 7.
A number line with an open circle at negative 6 with a bold line pointing to the left. A point at 9 with a bold line pointing to the right.
A number line with an open circle at negative 6 with a bold line pointing to the right ending at the point at 9.

Answers: 1
Other questions on the subject: Mathematics
Mathematics, 22.06.2019 00:00, egirl7838
Titus works at a hotel. part of his job is to keep the complimentary pitcher of water at least half full and always with ice. when he starts his shift, the water level shows 4 gallons, or 128 cups of water. as the shift progresses, he records the level of the water every 10 minutes. after 2 hours, he uses a regression calculator to compute an equation for the decrease in water. his equation is w –0.414t + 129.549, where t is the number of minutes and w is the level of water. according to the equation, after about how many minutes would the water level be less than or equal to 64 cups?
Answers: 2
Do you know the correct answer?
Questions in other subjects:


Mathematics, 18.07.2019 23:30


