


1986 6

Mathematics, 17.02.2021 16:40, quan1541
The table below shows the percentage of households that own computers.
Year Percent
1986 6
1987 8
1988 12
1989 19
1990 25
Using your calculator, find the equation for the line of best fit. What percentage of households
would own computers in the year 1997?
For easier data entry, you can let t represent the year: t = 6 for 1986, t = 7 for 1987, etc.
Round your answer to the nearest integer.
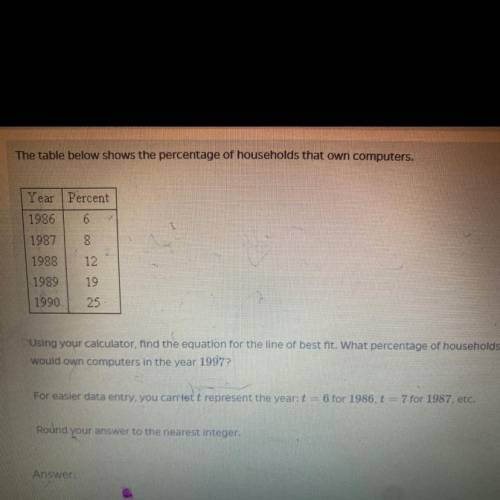

Answers: 2
Other questions on the subject: Mathematics
Mathematics, 21.06.2019 21:00, hernandez09297
At oaknoll school, 90 out of 270 students on computers. what percent of students at oak knoll school do not own computers? round the nearest tenth of a percent.
Answers: 1
Mathematics, 21.06.2019 23:40, asiababbie33
Agrid shows the positions of a subway stop and your house. the subway stop is located at (-5,2) and your house is located at (-9,9). what is the distance, to the nearest unit, between your house and the subway stop?
Answers: 1
Do you know the correct answer?
The table below shows the percentage of households that own computers.
Year Percent
1986 6
1986 6
Questions in other subjects:

Biology, 22.10.2021 23:10

History, 22.10.2021 23:10

Mathematics, 22.10.2021 23:10
Mathematics, 22.10.2021 23:10
Mathematics, 22.10.2021 23:10
Mathematics, 22.10.2021 23:10
Biology, 22.10.2021 23:10


