


PLEASE HELP
don't need to answer all but someone please help with a few questions!!!
(GR...

Mathematics, 17.02.2021 05:50, wiljoystoltz253
PLEASE HELP
don't need to answer all but someone please help with a few questions!!!
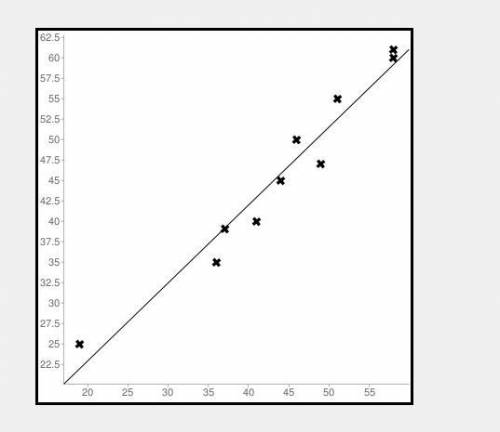
(GRAPH INCLUDED)
Which variable did you plot on the x-axis and which variable did you plot on the y-axis? Explain why you assigned the variables in that way.
Write the equation of the line of best fit using the slope-intercept formula y = mx + b. Show all your work, including the points used to determine the slope and how the equation was determined.
What does the slope of the line represent within the context of your graph? What does the y-intercept represent?
Test the residuals of two other points to determine how well the line of best fit models the data.
Use the line of best fit to help you to describe the data correlation.
Using the line of best fit that you found in Part Three, Question 2, approximate how tall is a person whose arms span is 66 inches?
According to your line of best fit, what is the arm span of a 74-inch-tall person?

Answers: 1
Other questions on the subject: Mathematics
Mathematics, 21.06.2019 16:30, jordivivar74
For how answer my question this will be the last question can you answer in math subject
Answers: 2
Mathematics, 21.06.2019 18:30, yeet6942000
Complex numbers multiply √-4 * √-25 and show all intermediate steps. alternative notation is sqrt(-4) * sqrt(-25).
Answers: 1
Mathematics, 21.06.2019 18:50, firenation18
The table represents a function. what is f(-2)? a.-3 b. -1 c.1 d.3
Answers: 1
Do you know the correct answer?
Questions in other subjects:

English, 14.04.2020 23:03
Mathematics, 14.04.2020 23:03
Mathematics, 14.04.2020 23:03

Advanced Placement (AP), 14.04.2020 23:03
Mathematics, 14.04.2020 23:03
Mathematics, 14.04.2020 23:03


