


The graph below shows the height of a
flower based on the number of weeks since it
was plante...

Mathematics, 17.02.2021 01:00, hannahponder
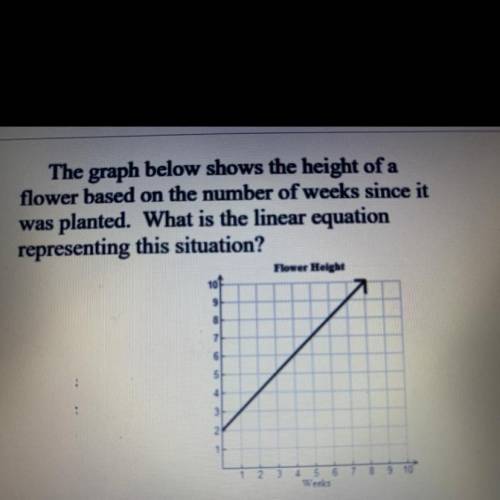
The graph below shows the height of a
flower based on the number of weeks since it
was planted. What is the linear equation
representing this situation?
A. y = -x + 2
B. y = x + 2
C. y = 1/2x + 2
D. y = 2x + 2

Answers: 1
Other questions on the subject: Mathematics
Mathematics, 21.06.2019 15:00, gabbyypadron
What are the relative frequencies to the nearest hundredth of the columns of the two-way table? a b group 1 102 34 group 2 18 14
Answers: 1
Mathematics, 21.06.2019 21:40, salinasroel22
In a survey of 1015 adults, a polling agency asked, "when you retire, do you think you will have enough money to live comfortably or not. of the 1015 surveyed, 534 stated that they were worried about having enough money to live comfortably in retirement. construct a 90% confidence interval for the proportion of adults who are worried about having enough money to live comfortably in retirement.
Answers: 3
Mathematics, 21.06.2019 23:40, aureliafung2p7cxoo
Mikes car gets an average of 28 mpg. there are 12 gallons of fuel in mikes car when he starts his trip of 140 miles. about how many gallons are left at the end of his trip?
Answers: 1
Do you know the correct answer?
Questions in other subjects:
Mathematics, 25.03.2020 21:47

History, 25.03.2020 21:47
History, 25.03.2020 21:47


