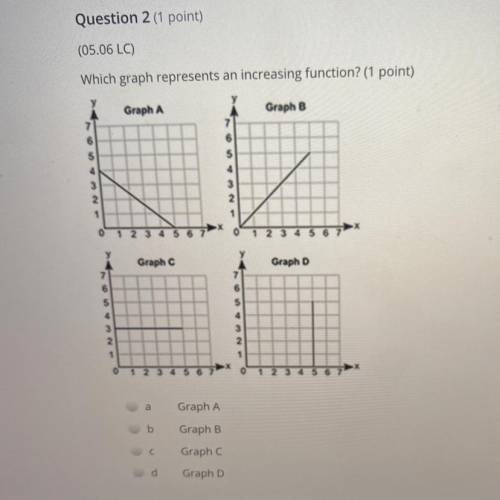
Which graph represents an increasing function? (1 point)
Graph A
Graph B
7
6
5
4
6
5
4
3
2
1
3
2
1
0
0
1 2 3
Graph C
Graph D
7
6
5
71
6
5
4
3
2
3
2.
1
1
0
1 2 3 4 5 6
o
a
Graph A
b
Graph B
CO
с
Graphc
d
Graph D
Jacob signs up to work for 2 1/2 hours at the school carnival. if each work shift is 3/4 hour, how many shifts will jacob work? (i just want to double check : |, for anybody that responds! : )
Savannah is painting a striped background for a mural on a wall that is 1515 yards long. she wants a total of 9696 stripes that are all the same width. which calculation should savannah use to decide how wide to make each stripe?
Rob spent 25%, percent more time on his research project than he had planned. he spent an extra h hours on the project. which of the following expressions could represent the number of hours rob actually spent on the project? two answers