Mathematics, 16.02.2021 23:40, evazquez
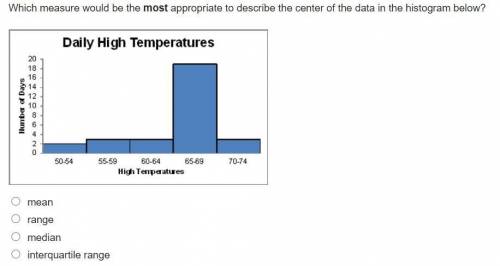
Which measure would be the most appropriate to describe the center of the data in the histogram below?
A bar graph entitled Daily High Temperatures has high temperatures on the x-axis and number of days on the y-axis, from 0 to 20. Temperatures were between 50 and 54 on 2 days; between 55 to 59 on 3 days; between 60 and 64 on 3 days; between 65 to 69 on 18 days; between 70 to 74 on 3 days.
mean
range
median
interquartile range


Answers: 3
Other questions on the subject: Mathematics


Mathematics, 21.06.2019 20:00, genyjoannerubiera
The weight v of an object on venus varies directly with its weight e on earth. a person weighing 120 lb on earth would weigh 106 lb on venus. how much would a person weighing 150 lb on earth weigh on venus?
Answers: 2

Mathematics, 21.06.2019 20:30, Gabyngreen
What is the interquartile range of this data set? 2, 5, 9, 11, 18, 30, 42, 48, 55, 73, 81
Answers: 1

Mathematics, 21.06.2019 20:30, brookieharrisop5n7us
What is the volume of the cone to the nearest cubic millimeter? (use π = 3.14) a) 46 mm3 b) 128 mm3 c) 183 mm3 d) 275 mm3 diameter = 5 mm height = 7 mm how do you do this problem step by step?
Answers: 1
Do you know the correct answer?
Which measure would be the most appropriate to describe the center of the data in the histogram belo...
Questions in other subjects:


Chemistry, 19.12.2019 02:31

Mathematics, 19.12.2019 02:31


Mathematics, 19.12.2019 02:31

Mathematics, 19.12.2019 02:31


