


The functions f(x) and g(x) are shown on the graph.
f(x) = X1
What is g(x)?
A. g(...

Mathematics, 15.02.2021 22:00, evy22
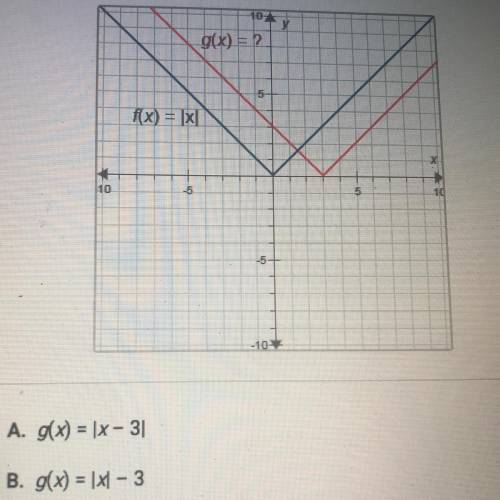
The functions f(x) and g(x) are shown on the graph.
f(x) = X1
What is g(x)?
A. g(x) = |x-3|
O B. g(x) = |X| - 3
C. g(x) = |x| + 3
D. g(x) = |x +3|

Answers: 3
Other questions on the subject: Mathematics
Mathematics, 21.06.2019 15:40, kevenluna10oytivm
What is the first quartile of the data set? 10, 11, 12, 15, 17, 19, 22, 24, 29, 33, 38 a. 12 b. 19 c. 29 d. 10
Answers: 1
Mathematics, 21.06.2019 21:40, avahrider1
The graph of f(x) = |x| is transformed to g(x) = |x + 11| - 7. on which interval is the function decreasing?
Answers: 3
Do you know the correct answer?
Questions in other subjects:

Social Studies, 17.11.2020 18:30

Social Studies, 17.11.2020 18:30

English, 17.11.2020 18:30

English, 17.11.2020 18:30
Mathematics, 17.11.2020 18:30
English, 17.11.2020 18:30
Mathematics, 17.11.2020 18:30


