


Name
Date
8. The graph below represents the number of containers and liters of water
co...

Mathematics, 15.02.2021 07:30, angie249
Name
Date
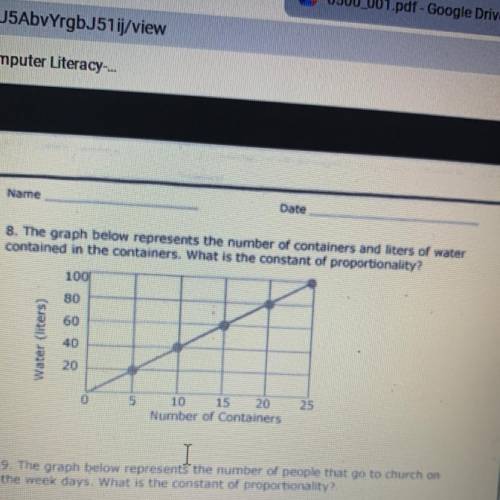
8. The graph below represents the number of containers and liters of water
contained in the containers. What is the constant of proportionality?
60
Water (liters)
10 15 20
Number of Containers
25
I
I
9. The graph below represents the number of mennte that

Answers: 1
Other questions on the subject: Mathematics
Mathematics, 21.06.2019 15:50, AaronMicrosoft15
If you shift the linear parent function, f(x)=x, up 13 units, what is the equation of the new function?
Answers: 1
Mathematics, 21.06.2019 20:30, amauris77748
There are 45 questions on your math exam. you answered 810 of them correctly. how many questions did you answer correctly?
Answers: 3
Mathematics, 21.06.2019 21:10, ttrinityelyse17
The table below shows the approximate height of an object x seconds after the object was dropped. the function h(x)= -16x^2 +100 models the data in the table. for which value of x would this model make it the least sense to use? a. -2.75 b. 0.25 c. 1.75 d. 2.25
Answers: 2
Mathematics, 21.06.2019 22:00, lokiliddel
In dire need~! describe how to use area models to find the quotient 2/3 divided by 1/5. check your work by also finding the quotient 2/3 divided by 1/5 using numerical operations only.
Answers: 3
Do you know the correct answer?
Questions in other subjects:

Biology, 01.02.2021 21:30
Mathematics, 01.02.2021 21:30


Social Studies, 01.02.2021 21:30
Biology, 01.02.2021 21:30
Mathematics, 01.02.2021 21:30
Mathematics, 01.02.2021 21:30
Mathematics, 01.02.2021 21:30


