
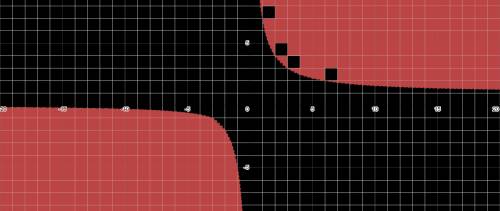


How do I graph in R for the following inequality?
-3 ≤ xV-6 > x...

Mathematics, 13.02.2021 20:10, nataliemoore1974
How do I graph in R for the following inequality?
-3 ≤ xV-6 > x

Answers: 3
Other questions on the subject: Mathematics
Mathematics, 21.06.2019 13:00, Christinelove23
Acompany is making new soccer uniforms for a team. the company uses 2.5 yards of fabric for each shirt. the company uses 82.5 yards of fabric to make shirts and shorts for 15 players. the equation and solution below represents the situation. 15(2.5+x)=82.5; x=3 what does the solution, x=3, represent?
Answers: 1
Mathematics, 21.06.2019 19:30, rockinrachel9099
Which table shows a proportional relationship between miles traveled and gas used?
Answers: 2
Mathematics, 21.06.2019 23:30, travawnward
What is the ratio for the surface areas of the cones shown below, given that they are similar and that the ratio of their radii and altitudes is 2: 1? submit
Answers: 1
Do you know the correct answer?
Questions in other subjects:


