Mathematics
Mathematics, 13.02.2021 05:20, am561740

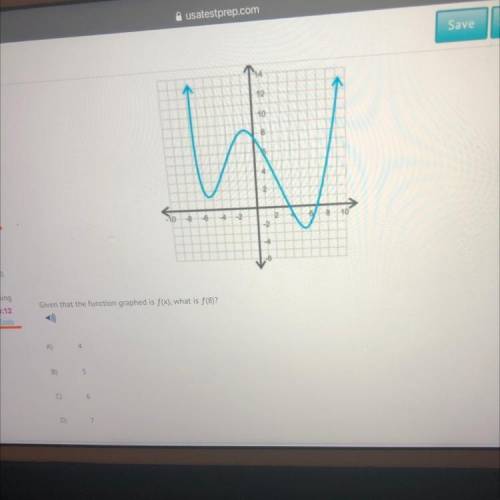
Given that the function graphed is f(x), what is f(8)?
A)
4
B)
5
6
D)
7


Given that the function graphed is f(x), what is f(8)?
A)
4
B)
5
6
D)
7

answer
Answers: 2

Other questions on the subject: Mathematics

image
Mathematics, 20.06.2019 18:02, Lilyy1k
Twenty percent of what number is 40?
Answers: 1
image
Mathematics, 22.06.2019 00:30, def88
Efficient homemakers ltd. makes canvas wallets and leather wallets as part of a money-making project. for the canvas wallets, they need two yards of canvas and two yards of leather. for the leather wallets, they need four yards of leather and three yards of canvas. their production unit has purchased 44 yards of leather and 40 yards of canvas. let x be the number of leather wallets and y be the number of canvas wallets. draw the graph showing the feasible region to represent the number of the leather and canvas wallets that can be produced.
Answers: 1
image
Mathematics, 22.06.2019 04:40, anhekb
The accompanying normal probability plot was constructed from a sample of 30 readings on tension for mesh screens behind the surface of video display tubes used in computer monitors. does it appear plausible that the tension distribution is normal? the given probability is has a significant downward curve, so it is plausible that the tension distribution is normal. the given probability is has a significant downward curve, so it is not plausible that the tension distribution is normal. the given probability is quite linear, so it is plausible that the tension distribution is normal. the given probability is has a significant upward curve, so it is not plausible that the tension distribution is normal. the given probability is quite linear, so it is not plausible that the tension distribution is normal.
Answers: 1
image
Mathematics, 22.06.2019 05:00, potato3999
Amanufacturing firm has been averaging 16.8 orders per week for several years. however, during a recession, orders appeared to slow. suppose the firm’s production manager randomly samples 31 weeks and finds an average of 15.6 orders with a standard deviation of 2.3 orders. using a 0.025 significance level, test whether the mean number of orders has decreased. type the full 5 step procedure into the answer box, then for multiple choice practice, answer the following: 1. what is the name and symbol of the parameter that you are testing? 2. what is the symbol and value of the point estimate of that parameter? 3. what distribution are you using to test this parameter? 4. what is the critical value? 5. what is the test statistic value? 6. what is the p-value?
Answers: 2
Do you know the correct answer?
Given that the function graphed is f(x), what is f(8)?
A)
4
B)
5
6

Questions in other subjects: