Mathematics, 13.02.2021 03:40, jazzy9927
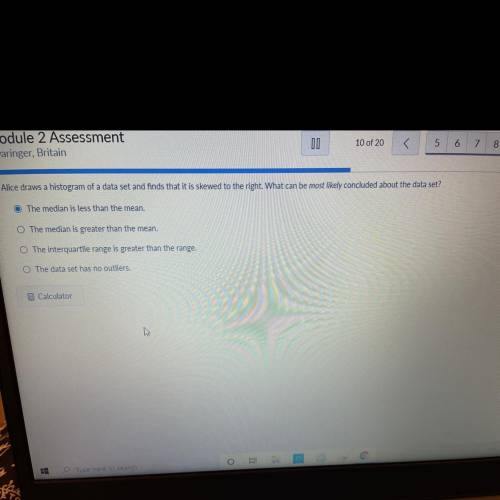
Alice draws a histogram of a data set and finds that it is skewed to the right. What can be most likely concluded about the data set?
The median is less than the mean.
The median is greater than the mean.
The interquartile range is greater than the range.
The data set has no outliers.


Answers: 3
Other questions on the subject: Mathematics


Mathematics, 21.06.2019 20:30, marahkotelman
Arectangle has a width of 5 cm and a length of 10 cm. if the width is increased by 3, how does the perimeter change?
Answers: 1


Mathematics, 22.06.2019 02:00, priscillavaladez1112
The product of 3 and a number increased by 8 is 31
Answers: 1
Do you know the correct answer?
Alice draws a histogram of a data set and finds that it is skewed to the right. What can be most lik...
Questions in other subjects:

History, 27.10.2020 17:20

Social Studies, 27.10.2020 17:20

English, 27.10.2020 17:20


English, 27.10.2020 17:20

Mathematics, 27.10.2020 17:20


Social Studies, 27.10.2020 17:20

Computers and Technology, 27.10.2020 17:20


