


I need to find out which one is right
...

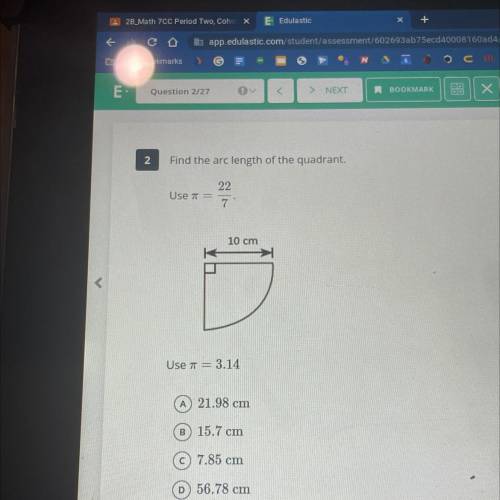
Answers: 2
Other questions on the subject: Mathematics

Mathematics, 21.06.2019 23:30, onepunchman20
What is the volume of a rectangular crate that has dimensions 9 inches by 9 inches by 1 feet? 1,458 in.3 121.5 in.3 1,012.5 in.3 36 in.3
Answers: 1
Mathematics, 22.06.2019 02:00, Zaxx2974
Part a what is the area of triangle i? show your calculation. part b triangles i and ii are congruent (of the same size and shape). what is the total area of triangles i and ii? show your calculation. part c what is the area of rectangle i? show your calculation. part d what is the area of rectangle ii? show your calculation. part e rectangles i and iii have the same size and shape. what is the total area of rectangles i and iii? show your calculation. part f what is the total area of all the rectangles? show your calculation. part g what areas do you need to know to find the surface area of the prism? part h what is the surface area of the prism? show your calculation. part i read this statement: “if you multiply the area of one rectangle in the figure by 3, you’ll get the total area of the rectangles.” is this statement true or false? why? part j read this statement: “if you multiply the area of one triangle in the figure by 2, you’ll get the total area of the triangles.” is this statement true or false? why?
Answers: 1
Mathematics, 22.06.2019 03:00, dominiqueallen23
Describe how the presence of possible outliers might be identified on the following. (a) histograms gap between the first bar and the rest of bars or between the last bar and the rest of bars large group of bars to the left or right of a gap higher center bar than surrounding bars gap around the center of the histogram higher far left or right bar than surrounding bars (b) dotplots large gap around the center of the data large gap between data on the far left side or the far right side and the rest of the data large groups of data to the left or right of a gap large group of data in the center of the dotplot large group of data on the left or right of the dotplot (c) stem-and-leaf displays several empty stems in the center of the stem-and-leaf display large group of data in stems on one of the far sides of the stem-and-leaf display large group of data near a gap several empty stems after stem including the lowest values or before stem including the highest values large group of data in the center stems (d) box-and-whisker plots data within the fences placed at q1 â’ 1.5(iqr) and at q3 + 1.5(iqr) data beyond the fences placed at q1 â’ 2(iqr) and at q3 + 2(iqr) data within the fences placed at q1 â’ 2(iqr) and at q3 + 2(iqr) data beyond the fences placed at q1 â’ 1.5(iqr) and at q3 + 1.5(iqr) data beyond the fences placed at q1 â’ 1(iqr) and at q3 + 1(iqr)
Answers: 1
Do you know the correct answer?
Questions in other subjects:

Spanish, 22.10.2019 18:50


Mathematics, 22.10.2019 18:50


