

Mathematics, 12.02.2021 20:50, lexiscaraballo12
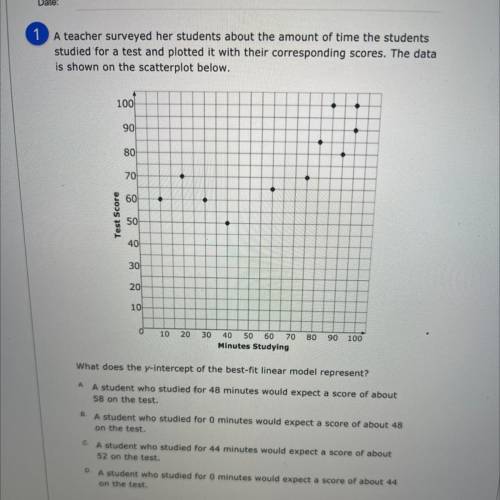
A teacher surveyed her students about the amount of time the students
studied for a test and plotted it with their corresponding scores. The data
is shown on the scatterplot below.
A
8.
What does the y-intercept of the best-fit linear model represent?
A student who studied for 48 minutes would expect a score of about
58 on the test.
A student who studied for 0 minutes would expect a score of about 48
on the test.
C. A student who studied for 44 minutes would expect a score of about
52 on the test.
D. A student who studied for 0 minutes would expect a score of about 44
on the test.
Review IF 6:10.7 Rate of Change in Context
Samantholimonadanthacown Sha. cocondrathambar

Answers: 3


Other questions on the subject: Mathematics
Mathematics, 21.06.2019 13:10, cristian901997
What is the greatest common factor of 8 and 36
Answers: 2
Mathematics, 21.06.2019 16:30, cameronbeaugh
The ratio of men to women working for a company is 4 to 5 . if there are 90 women working for the company, what is the total number of employees?
Answers: 1
Mathematics, 21.06.2019 21:20, ladawnrowles005
Drag each expression to the correct location on the solution. not all expressions will be used. consider the polynomial 8x + 2x2 - 20x - 5. factor by grouping to write the polynomial in factored form.
Answers: 1
Do you know the correct answer?
A teacher surveyed her students about the amount of time the students
studied for a test and plotte...
Questions in other subjects:


Mathematics, 25.09.2019 22:00

Physics, 25.09.2019 22:00
Mathematics, 25.09.2019 22:00
History, 25.09.2019 22:00
History, 25.09.2019 22:00


