

Mathematics, 12.02.2021 20:10, monaec1757
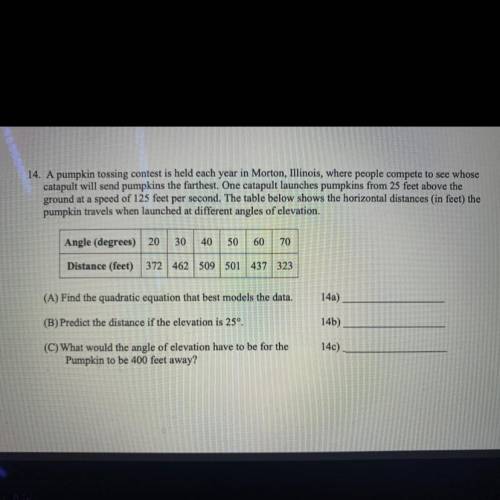
14. A pumpkin tossing contest is held each year in Morton, Illinois, where people compete to see whose
catapult will send pumpkins the farthest. One catapult launches pumpkins from 25 feet above the
ground at a speed of 125 feet per second. The table below shows the horizontal distances (in feet) the
pumpkin travels when launched at different angles of elevation.
Angle (degrees) 20
30
40 50 60 70
Distance (feet) 372 462 509 501 437 323
(A) Find the quadratic equation that best models the data.
14a)
(B) Predict the distance if the elevation is 25º.
14b)
140)
(C) What would the angle of elevation have to be for the
Pumpkin to be 400 feet away?

Answers: 1


Other questions on the subject: Mathematics
Mathematics, 21.06.2019 16:00, kell22wolf
Part one: measurements 1. measure your own height and arm span (from finger-tip to finger-tip) in inches. you will likely need some from a parent, guardian, or sibling to get accurate measurements. record your measurements on the "data record" document. use the "data record" to you complete part two of this project. name relationship to student x height in inches y arm span in inches archie dad 72 72 ginelle mom 65 66 sarah sister 64 65 meleah sister 66 3/4 67 rachel sister 53 1/2 53 emily auntie 66 1/2 66 hannah myself 66 1/2 69 part two: representation of data with plots 1. using graphing software of your choice, create a scatter plot of your data. predict the line of best fit, and sketch it on your graph. part three: the line of best fit include your scatter plot and the answers to the following questions in your word processing document 1. 1. which variable did you plot on the x-axis, and which variable did you plot on the y-axis? explain why you assigned the variables in that way. 2. write the equation of the line of best fit using the slope-intercept formula $y = mx + b$. show all your work, including the points used to determine the slope and how the equation was determined. 3. what does the slope of the line represent within the context of your graph? what does the y-intercept represent? 5. use the line of best fit to you to describe the data correlation.
Answers: 2
Mathematics, 21.06.2019 17:30, cupcakes5335
#1-20 state whether the angles are alternate interior, alternate exterior, vertical, or corresponding angles.
Answers: 2
Mathematics, 21.06.2019 18:30, corrineikerd
41/17 as a decimal rounded to the nearest hundredth
Answers: 1
Do you know the correct answer?
14. A pumpkin tossing contest is held each year in Morton, Illinois, where people compete to see who...
Questions in other subjects:

History, 20.09.2020 22:01

Mathematics, 20.09.2020 22:01
History, 20.09.2020 22:01


English, 20.09.2020 22:01


