

Mathematics, 12.02.2021 19:20, Ilcienne9736
8TH GRADE MATH QUESTION PLEASE HELP ME!
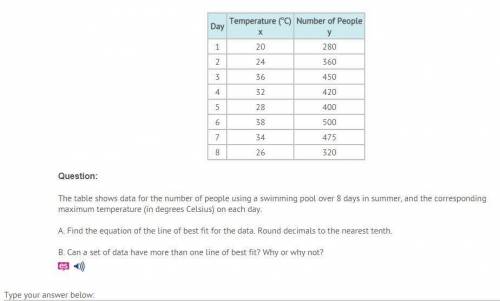
The table shows data for the number of people using a swimming pool over 8 days in summer, and the corresponding maximum temperature (in degrees Celsius) on each day.
A. Find the equation of the line of best fit for the data. Round decimals to the nearest tenth.
B. Can a set of data have more than one line of best fit? Why or why not?
There are no answer choices, it's a free response.

Answers: 3


Other questions on the subject: Mathematics
Mathematics, 21.06.2019 21:40, oprajapati
The management of a supermarket wants to adopt a new promotional policy of giving a free gift to every customer who spends more than a certain amount per visit at this supermarket. the expectation of the management is that after this promotional policy is advertised, the expenditures for all customers at this supermarket will be normally distributed with a mean of $95 and a standard deviation of $20. if the management wants to give free gifts to at most 10% of the customers, what should the amount be above which a customer would receive a free gift?
Answers: 2
Mathematics, 21.06.2019 22:00, lokiliddel
In dire need~! describe how to use area models to find the quotient 2/3 divided by 1/5. check your work by also finding the quotient 2/3 divided by 1/5 using numerical operations only.
Answers: 3
Mathematics, 21.06.2019 23:00, freebyyy7032
Unaware that 35% of the 10000 voters in his constituency support him, a politician decides to estimate his political strength. a sample of 200 voters shows that 40% support him. a. what is the population? b. what is the parameter of interest? state its value c. what is the statistics of the interest? state its value d. compare your answers in (b) and (c) is it surprising they are different? if the politician were to sample another 200 voters, which of the two numbers would most likely change? explain
Answers: 2
Do you know the correct answer?
8TH GRADE MATH QUESTION PLEASE HELP ME!
The table shows data for the number of people using a swimm...
Questions in other subjects:


English, 08.10.2019 10:10
Health, 08.10.2019 10:10
Mathematics, 08.10.2019 10:10
Mathematics, 08.10.2019 10:10

History, 08.10.2019 10:10


