


The graph shows a proportional relationship. Which equation matches the graph?
A. y=2x
B. y=1/...

Mathematics, 12.02.2021 14:00, alexa3941
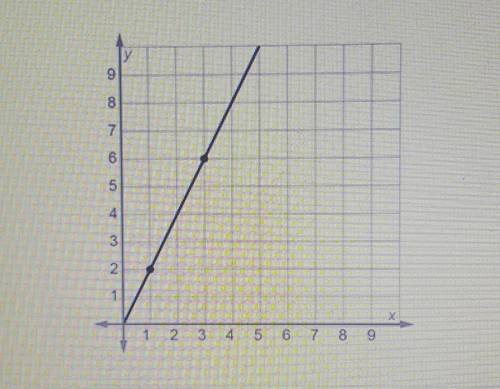
The graph shows a proportional relationship. Which equation matches the graph?
A. y=2x
B. y=1/2x
C. y=4x
D. y=x

Answers: 2
Other questions on the subject: Mathematics
Mathematics, 21.06.2019 17:00, KHaire2077
In a sample of 2023 u. s. adults, 373 said franklin roosevelt was the best president since world war ii. two u. s. adults are selected at random from the population of all u. s. adults without replacement. assuming the sample is representative of all u. s. adults, complete parts (a) through (d). (a) find the probability that both adults say franklin roosevelt was the best president since world war ii. the probability that both adults say franklin roosevelt was the best president since world war ii is (round to three decimal places as needed.) (b) find the probability that neither adult says franklin roosevelt was the best president since world war ii. the probability that neither adult says franklin roosevelt was the best president since world war ii is (round to three decimal places as needed.) (c) find the probability that at least one of the two adults says franklin roosevelt was the best president since world war ii. the probability that at least one of the two adults says franklin roosevelt was the best president since world war ii is (round to three decimal places as needed.) (d) which of the events can be considered unusual? explain. select all that apply. the event in part left parenthesis a right parenthesis is unusual because its probability is less than or equal to 0.05. the event in part (b) is unusual because its probability is less than or equal to 0.05. none of these events are unusual. the event in part (c) is unusual because its probability is less than or equal to 0.05.
Answers: 3
Mathematics, 22.06.2019 05:40, kris7726
For a short time after a wave is created by wind , the height of the wave can be modeled using y= a sin 2pi(t) / t where a is the amplitude and t is the period of the wave in seconds. how many times over the first 5 seconds does the graph predict the wave to be 2 feet high?
Answers: 1
Mathematics, 22.06.2019 07:30, bbyitskeke7160
Which sample fairly represents the population? check all that apply.
Answers: 1
Mathematics, 22.06.2019 07:50, hernan99961
Find the inverse of the function y = x2 - 12. y=+vx-12 y=+nx+ 12 y=+nx - 12 y=vx + 12
Answers: 2
Do you know the correct answer?
Questions in other subjects:


Advanced Placement (AP), 20.07.2019 06:30
Mathematics, 20.07.2019 06:30
Mathematics, 20.07.2019 06:30


Social Studies, 20.07.2019 06:30


