

Mathematics, 12.02.2021 14:00, GabbyLandry
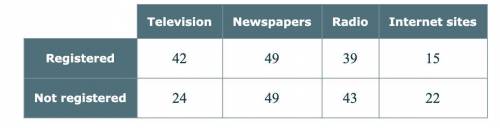
A sample of 283 adults is selected. The adults are classified according to voter registration status ("registered" or "not registered"). They are also classified according to preferred source of current events information ("television", "newspapers", "radio", or "internet sites"). The results are given in the contingency table below.
What is the relative frequency of adults in the sample who prefer to obtain their information through television?
Round your answer to two decimal places.

Answers: 1


Other questions on the subject: Mathematics
Mathematics, 21.06.2019 20:30, jmcd10
Create a question with this scenario you could ask that could be answered only by graphing or using logarithm. david estimated he had about 20 fish in his pond. a year later, there were about 1.5 times as many fish. the year after that, the number of fish increased by a factor of 1.5 again. the number of fish is modeled by f(x)=20(1.5)^x.
Answers: 1
Mathematics, 22.06.2019 01:10, Weser17
Jobs and productivity! how do retail stores rate? one way to answer this question is to examine annual profits per employee. the following data give annual profits per employee (in units of 1 thousand dollars per employee) for companies in retail sales. assume σ ≈ 4.0 thousand dollars. 3.7 6.7 3.6 8.5 7.5 5.9 8.7 6.4 2.6 2.9 8.1 −1.9 11.9 8.2 6.4 4.7 5.5 4.8 3.0 4.3 −6.0 1.5 2.9 4.8 −1.7 9.4 5.5 5.8 4.7 6.2 15.0 4.1 3.7 5.1 4.2 (a) use a calculator or appropriate computer software to find x for the preceding data. (round your answer to two decimal places.) thousand dollars per employee (b) let us say that the preceding data are representative of the entire sector of retail sales companies. find an 80% confidence interval for μ, the average annual profit per employee for retail sales. (round your answers to two decimal places.) lower limit -- thousand dollars upper limit -- thousand dollars (c) let us say that you are the manager of a retail store with a large number of employees. suppose the annual profits are less than 3 thousand dollars per employee. do you think this might be low compared with other retail stores? explain by referring to the confidence interval you computed in part (b). yes. this confidence interval suggests that the profits per employee are less than those of other retail stores. no. this confidence interval suggests that the profits per employee do not differ from those of other retail stores. correct: your answer is correct. (d) suppose the annual profits are more than 6.5 thousand dollars per employee. as store manager, would you feel somewhat better? explain by referring to the confidence interval you computed in part (b). yes. this confidence interval suggests that the profits per employee are greater than those of other retail stores. no. this confidence interval suggests that the profits per employee do not differ from those of other retail stores. (e) find an 95% confidence interval for μ, the average annual profit per employee for retail sales. (round your answers to two decimal places.) lower limit 3.75 incorrect: your answer is incorrect. thousand dollars upper limit 6.41 incorrect: your answer is incorrect. thousand dollars
Answers: 3
Mathematics, 22.06.2019 01:10, tamekiablair502
Stefania pours 2 liters of orange juice and 1.5 liters of pineapple juice into a punch bowl. how many liters are in the punch bowl?
Answers: 1
Do you know the correct answer?
A sample of 283 adults is selected. The adults are classified according to voter registration status...
Questions in other subjects:


Mathematics, 11.11.2020 08:40

Mathematics, 11.11.2020 08:40
Biology, 11.11.2020 08:40


